3
Summary tables and graphs
The summary tables detail the supply of housing for the Belfast district from 1 April 2024 to 31 March 2025 and provide a snapshot of the land remaining for housing and its associated potential capacity to accommodate new homes. Cumulative totals are also provided since the council’s housing monitor was established – that is 1 April 2015, the date at which the council gained statutory responsibility for planning.
3.1 Settlement summary
Table 1 provides a breakdown of the housing supply, land availability and capacity for future housing units for each settlement within the district, including Belfast City and the small settlements of Edenderry, Hannahstown and Loughview.
Belfast City is then further sub-divided into a number of settlement areas or sectors based on key designations within the prevailing development plan. These areas include Belfast City Centre, the Belfast Harbour Estate and Outer Belfast, which is defined as the area covered by the Settlement Limit of Belfast City outside of the City Centre and Harbour Area.
The data within the table is divided into these columns:
- Area Developed 1 April 2024 to 31 March 2025 – the area of land in hectares (ha) developed during the current monitor year;
- Area Developed 1 April 2015 to 31 March 2025 – the cumulative area of land in hectares (ha) developed to date from 1 April 2015 (the date at which the council gained statutory responsibility for planning);
- Units Complete 1 April 2024 to 31 March 2025 – the number of dwellings completed during the current monitor year;
- Units Complete 1 April 2015 to 31 March 2025 – the cumulative total number of dwellings completed to date from 1 April 2015 (the date at which the council gained statutory responsibility for planning);
- Available Potential (Hectares) – the area of land estimated as available for additional dwelling completions within monitored sites as at 31 March 2025; and
- Available Potential (Dwelling Units) – the estimated number of dwellings that could be accommodated on the available potential land as at 31 March 2025.
During the 2024-2025 monitoring year, 531 units were completed on 9.7 ha of land across the district. 338.6 ha of land remains, with potential capacity for 20,246 units. Within Belfast City, 435 units completed were within Outer Belfast, with a further 88 units completed within the City Centre. 10,895 of the available potential units are within Outer Belfast, whilst 6,141 and 3,197 potential dwelling units remain in the City Centre and Harbour Area respectively. There were eight completions in Edenderry, no completions in Hannahstown or Loughview with a total of 13 potential dwelling units available across these three Small Settlements.
Figure 1 shows the total dwellings completed for the district from 2015-2016 to present, to allow for an analysis of trends over a longer timeframe. The total number of dwellings completed in the district has decreased by 9.4 per cent from 586 in 2023-2024 to 531 in the current monitor year.
3.2 Urban Footprint Summary
Table 2 provides a breakdown of the housing supply, land availability and capacity for future housing units within Belfast City, further categorised into land within the identified Urban Footprint (Footnote three) or Greenfield land. This only refers to Belfast City, given that the Urban Footprint is only defined in relation to settlements with a population greater than 5,000 people. This excludes Belfast’s three Small Settlements.
In addition to the columns featured in Table 1 (as described in Section 3.1), the units within the Urban Footprint (percentage) row calculates the proportion of dwellings completed within the Urban Footprint during the current monitor year and the cumulative total number of dwellings completed to date from 1 April 2015 (the date at which the council gained statutory responsibility for planning), expressed as a percentage of the total number of dwellings completed over the respective time periods.
89.1 per cent of the 523 units completed within Belfast city were built on land within the Urban Footprint. Of the remaining potential dwelling units, 96 per cent are within the Urban Footprint.
Figure 2 shows the proportion of dwellings completed within the Urban Footprint for the district from 2015-2016 to present, to allow for an analysis of trends over a longer timeframe. The proportion of dwellings completed within the Urban Footprint has increased from 80.8 per cent in 2023-2024 to 89.1 per cent in the current monitor year.
3.3 Land use zoning summary
Table 3 provides a breakdown of the dwelling units completed by type of land use zoning within the prevailing development plan within each settlement or settlement area. The data within this table is divided into these columns:
- Land Zoned for Housing – the number of units completed and the remaining potential units on land allocated for residential use within the prevailing development plan;
- Land Zoned for Mixed Use – the number of units completed and the remaining potential units on land zoned for mixed use development, which includes an element of residential development within key site requirements;
- All other land – the number of units completed and the remaining potential units on any other land not falling within the first two, which include non-zoned land and land zoned for non-residential uses; and
- Proportion of Zoned Land (percentage) – the proportion of units completed on either housing or mixed use zoned land expressed as a percentage of the total number of dwellings completed.
Figure 3 shows the proportion of units completed for the district on both housing or mixed use zoned land expressed as a percentage of the total number of dwellings completed from 2015-2016 to present. This proportion has decreased from 26.8 per cent in 2023-2024 to 24.9 per cent in the current monitor year. Figure 4 shows the total number of units completed on all other land. This ‘windfall’ provision has decreased by seven per cent from 429 units in 2023-2024 to 399 in the current monitor year.
Table 4 provides details of the capacity for future dwelling units on the same basis as Table 3. Of the remaining potential available for future dwellings, 29.8 per cent is currently zoned for housing or mixed use. 2,508 of the available 20,246 potential dwelling units can be delivered on land zoned for housing and 3,534 units on land zoned for mixed use. In comparison, 14,204 of the remaining potential units can be provided on all other land.
Table 1 Settlement summary 2024 to 2025
Hectare values in the table might not tally due to rounding.
| Settlement | Area developed (hectares) | Units complete | Available potential (hectares) | Available potential (dwelling units) | ||
|---|---|---|---|---|---|---|
| 1 April 2024 to 31 March 2025 | 1 April 2025 to 31 March 2025 | 1 April 2024 to 31 March 2025 | 1 April 2015 to 31 March 2025 | |||
| Belfast city | ||||||
| Outer Belfast | 8.9 | 161.5 | 435 | 6,085 | 211.9 | 10,895 |
| City centre | 0.5 | 3.2 | 88 | 521 | 38.8 | 6,141 |
| Harbour area | 0.0 | 0.0 | 0 | 0 | 86.4 | 3,197 |
| Belfast city total | 9.4 | 164.7 | 523 | 6,606 | 337.1 | 20,233 |
| Small settlements | ||||||
| Edenderry | 0.3 | 0.6 | 8 | 15 | 0.6 | 6 |
| Hannahstown | 0.0 | 1.0 | 0 | 23 | 0.9 | 6 |
| Loughview | 0.0 | 0.0 | 0 | 0 | 0.2 | 1 |
| Small settlement total | 0.3 | 1.6 | 8 | 38 | 1.7 | 13 |
| Belfast district total | 9.7 | 166.3 | 531 | 6,644 | 338.6 | 20,246 |
Table 2 Urban footprint summary 2023 to 2024
Hectare values in the table might not tally due to rounding.
| Settlement or area | Area developed (hectares) | Units complete | Available potential (hectares) | Available potential (dwelling units) | ||
|---|---|---|---|---|---|---|
| 1 April 2024 to 31 March 2025 | 1 April 2015 to 31 March 2025 | 1 April 2024 to 31 March 2025 | 1 April 2015 to 31 March 2025 | |||
| Urban footprint | 6.8 | 117.7 | 466 | 5,616 | 304.7 | 19,431 |
| Percentage of units within Urban footprint | 0 | 0 | 89.1 per cent | 85 per cent | 0.0 | 96 per cent |
| Green field | 2.7 | 47.1 | 57 | 990 | 32.2 | 802 |
| Belfast city total | 9.4 | 164.7 | 523 | 6,606 | 337.1 | 20,233 |
Figure 1 Total dwellings completed between 2015 and 2025
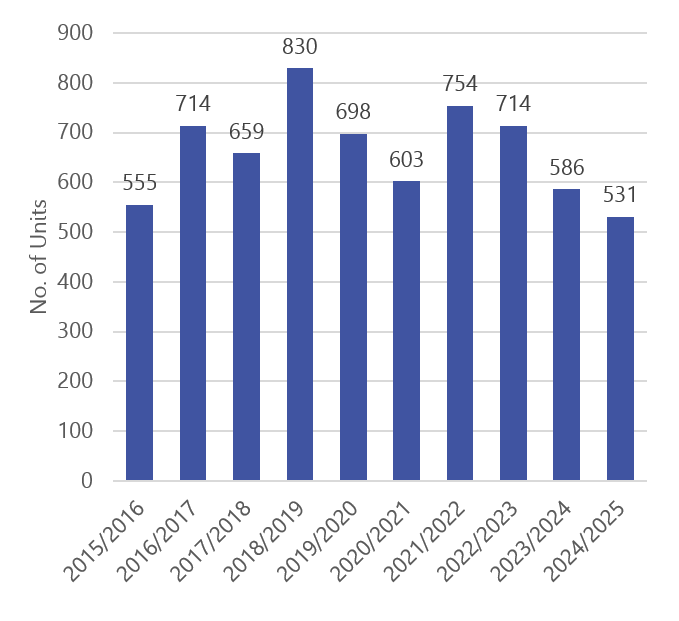
Figure 2 Proportion of dwellings completed within the urban footprint between 2015 and 2025
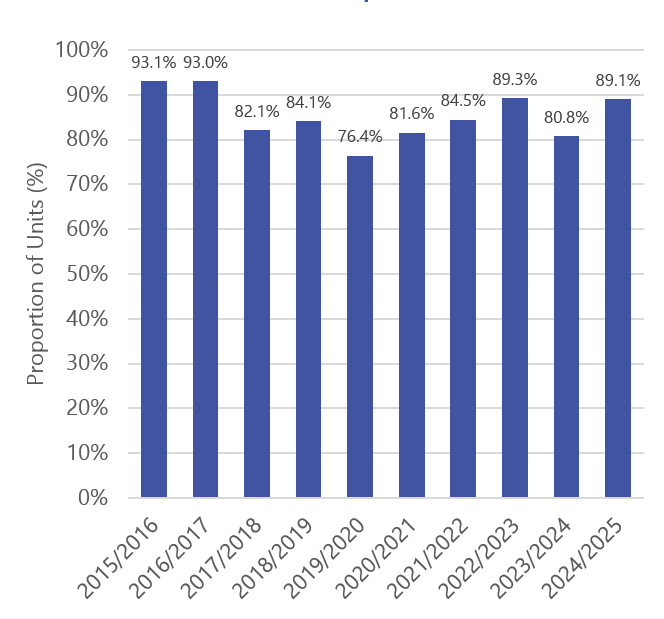
Table 3 Land use zoning completed units 2024 to 2025
| Settlement or area | Units complete | |||||||||
|---|---|---|---|---|---|---|---|---|---|---|
| Land zoned for housing | Land zoned for mixed use | All other land | Total | Proportion on zoned land (per cent) | ||||||
| 1 April 2024 to 31 March 2025 | 1 April 2015 to 31 March 2025 | 1 April 2024 to 31 March 2025 | 1 April 2015 to 31 March 2025 | 1 April 2024 to 31 March 2025 | 1 April 2015 to 31 March 2025 | 1 April 2024 to 31 March 2025 | 1 April 2015 to 31 March 2025 | 1 April 2024 to 31 March 2025 | 1 April 2015 to 31 March 2025 | |
| Belfast | ||||||||||
| Outer Belfast | 60 | 1,699 | 63 | 194 | 312 | 4,192 | 435 | 6,085 | 28.3% | 31.1% |
| City centre | 9 | 46 | Not applicable | Not applicable | 79 | 475 | 88 | 521 | 10.2% | 8.8% |
| Harbour area | Not applicable | Not applicable | 0 | 0 | 0 | 0 | 0 | 0 | 0% | 0% |
| Belfast total | 69 | 1,745 | 63 | 194 | 391 | 4,667 | 523 | 6,606 | 25.2% | 29.4% |
| Small settlements | ||||||||||
| Edenderry | Not applicable | Not applicable | Not applicable | Not applicable | 8 | 15 | 8 | 15 | Not applicable | Not applicable |
| Hannahstown | Not applicable | Not applicable | Not applicable | Not applicable | 0 | 23 | 0 | 23 | Not applicable | Not applicable |
| Loughview | Not applicable | Not applicable | Not applicable | Not applicable | 0 | 0 | 0 | 0 | Not applicable | Not applicable |
| Small settlement total | Not applicable | Not applicable | Not applicable | Not applicable | 8 | 38 | 8 | 38 | Not applicable | Not applicable |
| Belfast district total | 69 | 1,745 | 63 | 194 | 399 | 4,705 | 531 | 6,644 | 24.9% | 29.2% |
Figure 3 Proportion of units completed on zoned land between 2015 and 2025
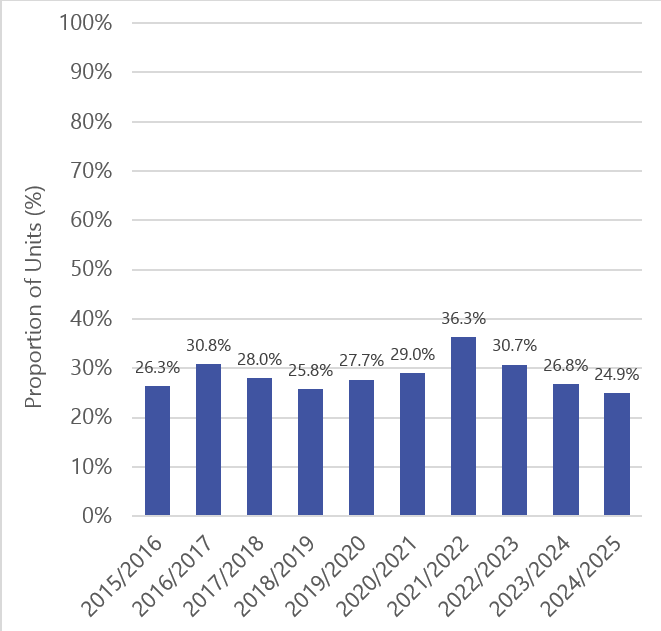
Figure 4 Number of units completed on all other land between 2015 and 2025
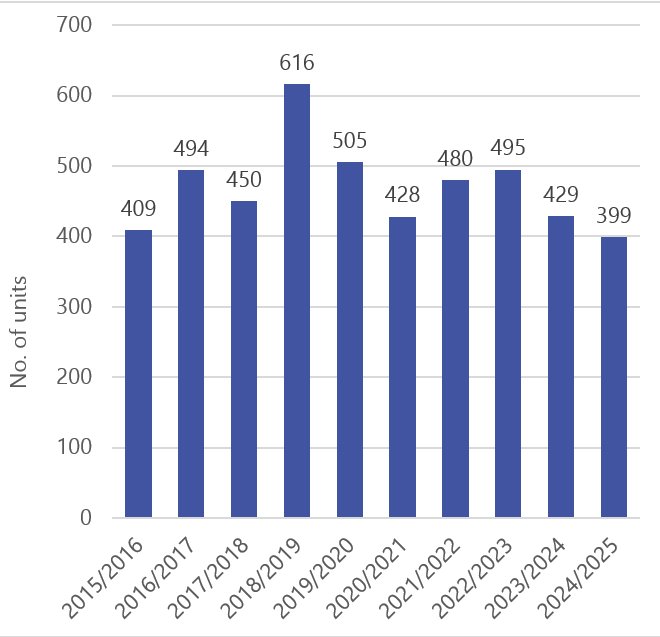
Table 4 Land use zoning and remaining potential units in 2024 to 2025
| Settlement or area | Remaining potential units | |||||||||
|---|---|---|---|---|---|---|---|---|---|---|
| Land zoned for housing | Land zoned for mixed use | All other land | Total | Proportion of units on zoned land (percentage) | ||||||
| Belfast city | ||||||||||
| Outer Belfast | 2,329 | 519 | 8,047 | 10,895 | 26.1% | |||||
| City centre | 179 | Not applicable | 5,962 | 6,141 | 2.9% | |||||
| Harbour area | Not applicable | 3,015 | 182 | 3,197 | 96.3% | |||||
| Belfast city total | 2,508 | 3,534 | 14,191 | 20,233 | 29.9% | |||||
| Small settlements | ||||||||||
| Edenderry | Not applicable | Not applicable | 6 | 6 | Not applicable | |||||
| Hannahstown | Not applicable | Not applicable | 6 | 6 | Not applicable | |||||
| Loughview | Not applicable | Not applicable | 1 | 1 | Not applicable | |||||
| Small settlement total | Not applicable | Not applicable | 13 | 13 | Not applicable | |||||
| Belfast district total | 2,508 | 3,534 | 14,204 | 20,246 | 29.8% | |||||
Footnotes
Footnote three: The Urban Footprint is defined within the Regional Development Strategy 2035 as 'the continuous built-up area of the settlement'. The Urban Footprint boundary was updated as part of the UCS (March 2018) as explained in the Belfast Housing Land Availability Summary Report 2017 to 2018. The 2018 Urban Footprint forms a revised baseline position for the 2017 to 2018 monitor period onwards.