Summary tables
Terminology
- Area (ha) = Area (hectares)
- m2 = Square metres
Table 1: Completions for monitor period from 1 April 2024 to 31 March 2025
| Completed gains or losses | Office (B1A) | Call centres (B1B) | Research and design (B1C) | Light industry (B2) | General industry (B3) | Storage and distribution (B4) | Total | |||||||
|---|---|---|---|---|---|---|---|---|---|---|---|---|---|---|
| Area (ha) | m2 | Area (ha) | m2 | Area (ha) | m2 | Area (ha) | m2 | Area (ha) | m2 | Area (ha) | m2 | Area (ha) | m2 | |
| Completed (gains) 1 April 2024 to 31 March 2025 | 0.8 | 11,315 | 0 | 0 | 0 | 0 | 0.3 | 594 | 0 | 0 | 1.6 | 6,267 | 2.8 | 18,176 |
| Completed (losses) 1 April 2024 to 31 March 2025 | 0 | 603 | 0 | 0 | 0 | 0 | 0.5 | 2,531 | 0 | 0 | 0 | 0 | 0.5 | 3,134 |
| Net change | 0.8 | 10,712 | 0 | 0 | 0 | 0 | -0.2 | -1,937 | 0.01 | 0 | 1.62 | 6,267 | 2.3 | 15,042 |
Table 2: Completions across four monitor periods, from 1 April 2021 to 31 March 2025
| Completed gains or losses | Office (B1A) | Call centres (B1B) | Research and design (B1C) | Light industry (B2) | General industry (B3) | Storage and distribution (B4) | Total | |||||||
|---|---|---|---|---|---|---|---|---|---|---|---|---|---|---|
| Area (ha) | m2 | Area (ha) | m2 | Area (ha) | m2 | Area (ha) | m2 | Area (ha) | m2 | Area (ha) | m2 | Area (ha) | m2 | |
| Completed (gains) 1 April 2021 to 31 March 2025 | 9.4 | 87,730 | 0 | 0 | 1.6 | 11,714 | 4.3 | 10,350 | 0 | 0 | 3.8 | 10,551 | 19.1 | 120,345 |
| Annual average | 4.7 | 43,865 | 0 | 0 | 0.8 | 5,857 | 2.1 | 5,175 | 0 | 0 | 1.9 | 5,276 | 9.5 | 60,172 |
| Completed (losses) 1 April 2021 to 31 March 2025 | 0.8 | 10,574 | 0 | 0 | 0 | 0.5 | 2,531 | 0 | 0 | 0.1 | 1,210 | 1.4 | 14,315 | |
| Annual average | 0.4 | 5,287 | 0 | 0 | 0 | 0.2 | 1,266 | 0 | 0 | 0.1 | 605 | 0.7 | 7,158 | |
| Net change | 8.6 | 77,156 | 0 | 0 | 1.6 | 11,714 | 3.8 | 7,819 | 0 | 0 | 3.7 | 9,341 | 17.7 | 106,030 |
Figure 1: Completions by Use Classes across three monitor periods from 2022-2023 to 2024-2025 (in square metres)
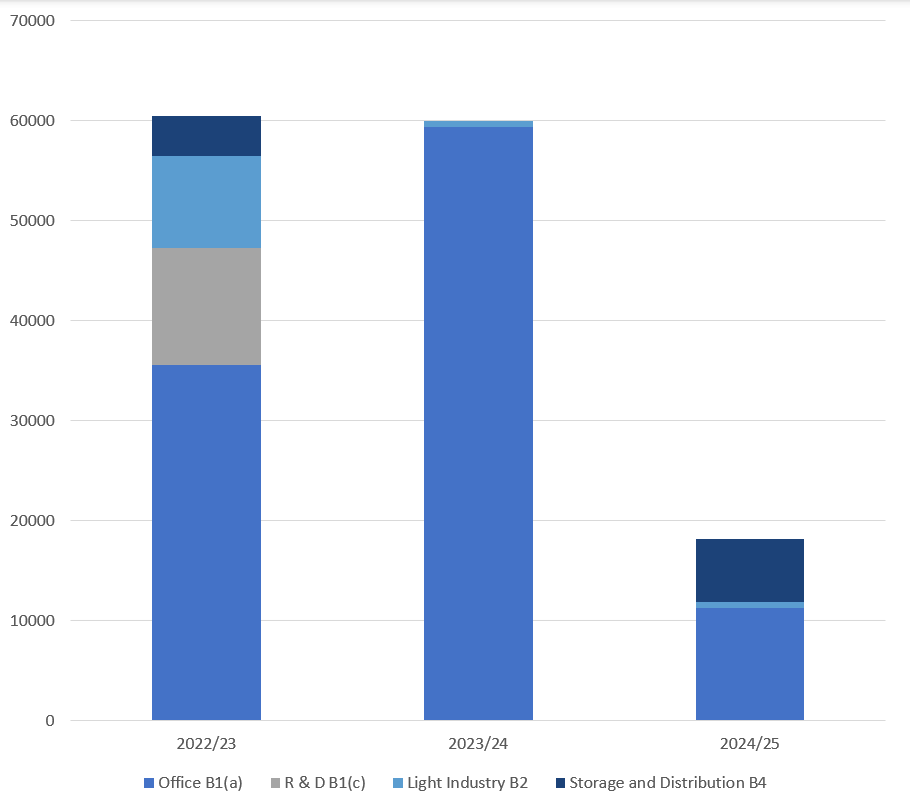
Figure 2: Completions (gains) by location across monitor periods 2022-23 to 2024-25 (per cent)
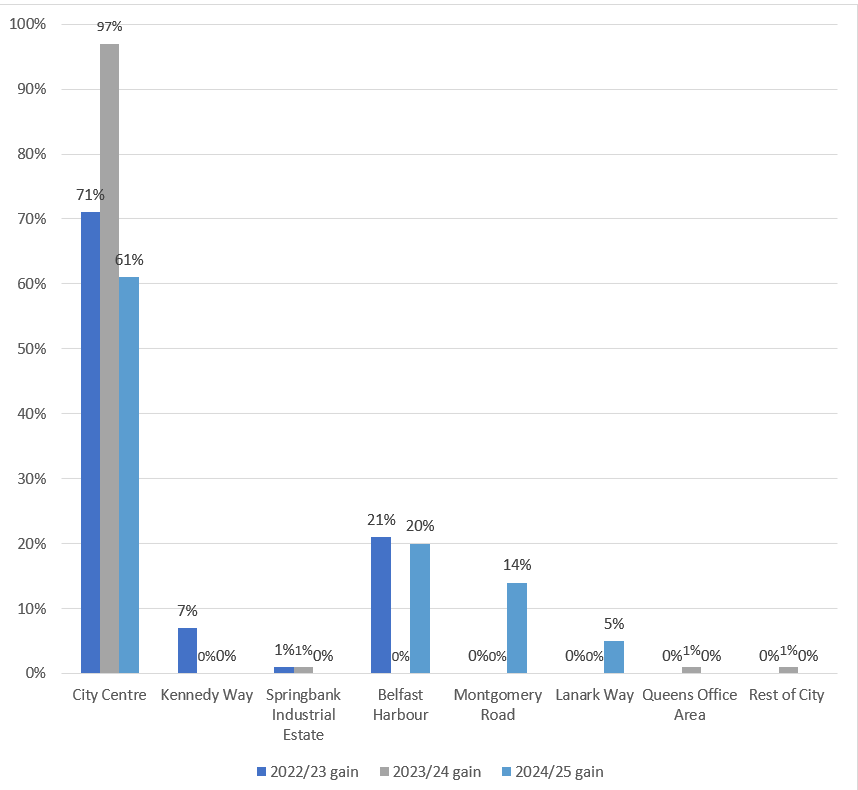
Table 3: Development under construction, extant permission (gains and losses)
| Completed gains or losses | Office (B1A) | Call centres (B1B) | Research and design (B1C) | Light industry (B2) | General industry (B3) | Storage and distribution (B4) | Vacant employment land | Total | ||||||||
|---|---|---|---|---|---|---|---|---|---|---|---|---|---|---|---|---|
| Area (ha) | m2 | Area (ha) | m2 | Area (ha) | m2 | Area (ha) | m2 | Area (ha) | m2 | Area (ha) | m2 | Area (ha) | m2 | Area (ha) | m2 | |
| Development ongoing gains at 31 March 2025 | 6.90 | 20,661 | 2.85 | 6,873 | 0 | 0 | 2.33 | 8,119 | 0 | 0 | 3.85 | 1,183 | Read * note | Read * note | 16 | 36,836 |
| Not started gains full and outline at 31 March 2025 | 100.29 | 397,000 | 15.6 | 1,306 | 12.61 | 23,661 | 17.1 | 44,235 | 42.79 | 32,735 | 23.97 | 33,040 | Read * note | Read * note | 212 | 531,977 |
| Sub total | 107.19 | 417,661 | 18.45 | 8,179 | 12.61 | 23,661 | 19.46 | 52,353 | 42.79 | 32,735 | 27.82 | 34,223 | Read * note | Read * note | 228 | 568,813 |
| Losses not started at 31 March 2025 | 6.41 | 39,057 | 0.13 | 1,868 | 0.12 | 381 | 2.35 | 8,346 | 2.9 | 11,779 | 11.05 | 27,591 | 0 | 0 | 23 | 89,022 |
| Net total | 101 | 378,604 | 18 | 6,311 | 12 | 23,280 | 17 | 44,007 | 39.89 | 20,956 | 16.77 | 6,632 | 0 | 0 | 205 | 479,791 |
* For vacant employment land not covered by an existing planning consent, refer to table 4.
Table 4: Completions (gains) and remaining capacity by location in Belfast
Remaining potential from vacant developable land column includes vacant employment land not covered by an existing planning consent.
| Location reference number | Location | Completions (gains) | Remaining capacity | ||
|---|---|---|---|---|---|
| 1 April 2024 to 31 March 2025 | 1 April 2023 to 31 March 2024 | Remaining potential from extant permissions and under construction | Remaining potential from vacant developable land | ||
| CC | City centre | 11,169 | 57,949 | 325,015 | Read * note |
| ML 08 | Kilwee Industrial Estate, Dunmurry | 0 | 0 | 0 | 811 |
| BT 005/05 | Hillview Road | 0 | 0 | 3,543 | 1,416 |
| BT 005/19 | Ballygomartin Industrial Estate, Ballygomartin Road | 0 | 0 | 862 | 374 |
| BT 005/10 | Glenbank Business Park, Crumlin Road | 0 | 0 | 0 | 11,988 |
| BT 005/25 | North Howard Link | 0 | 0 | 0 | Read * note |
| BT 005/15 | Kennedy Way | 0 | 0 | 3,859 | Read * note |
| BT 005/04 | Castlereagh Road | 0 | 0 | 0 | 2,423 |
| MCH 09 | Prince Regent Road | 0 | 0 | 5,243 | 3,332 |
| ML 07 | Springbank Industrial Estate | 0 | 798 | 3,017 | 35,199 |
| BT 005/13 | Ravenhill Business Park | 0 | 0 | 0 | Read * note |
| BT 005/09 | Shore Road, Skegioneill Street | 0 | 0 | 0 | 629 |
| BT 004 | Land at Springfield Road (former Mackie's site) | 0 | 0 | 0 | 65,122 |
| BT 005/11 | Donegall Road | 0 | 0 | 0 | Read * note |
| BT 005/08 | Duncairn Gardens | 0 | 0 | 1,618 | 342 |
| BHA 06 | Belfast Harbour | 3,716 | 0 | 53,713 | 101,745 |
| BT 005/17 | Westlink Enterprise Centre, Distillery Street | 0 | 0 | 0 | 1,281 |
| MCH 10 | Montgomery Road | 2,551 | 0 | 11,866 | Read * note |
| BT 005/20 | Lanark Way | 740 | 0 | 448 | 641 |
| BT 005/07 | York Road including Jennymount Business Park | 0 | 0 | 563 | Read * note |
| BT 005/12 | Stockman's Way | 0 | 0 | 283 | Read * note |
| MCH 11 | Ballygowan Road | 0 | 0 | 0 | Read * note |
| BT 005/02 | Island Street, Ballymacarrett Road | 0 | 0 | 0 | 331 |
| BT 005/21 | Argyle Business Park, Shankill Road | 0 | 0 | 0 | Read * note |
| BT 005/01 | Newtownards Road, Tamar Street | 0 | 0 | 0 | Read * note |
| BT 005/18 | Springfield Road | 0 | 0 | 3,121 | 5,107 |
| BT 005/22 | Agnes Street Industrial Estate | 0 | 0 | 456 | Read * note |
| BT 005/03 | East Belfast Enterprise Park | 0 | 0 | 0 | Read * note |
| BT 005/23 | Louden Street, Townsend Street | 0 | 0 | 0 | Read * note |
| BT 005/16 | Whiterock Industrial Estate, Springfield Road | 0 | 0 | 13,177 | 6,652 |
| BT 005/26 | Conway Street | 0 | 0 | 0 | Read * note |
| BT 005/06 | Cambrai Street | 0 | 0 | 310 | Read * note |
| BT 005/24 | Andrews Mill, Divis Street | 0 | 0 | 0 | Read * note |
| BT 005/14 | Glen Road | 0 | 0 | 20 | Read * note |
| ML 05 | Seymour Industrial Estate | 0 | 0 | 0 | 3,598 |
| ROC | Rest of city | 0 | 717 | 34,250 | Read * note |
| BHA 01 | Titanic Quarter | 0 | 0 | 59,309 | Read ** note |
| QOA | Queen's office area | 0 | 525 | 0 | Read * note |
| ODL | Outside development limits | 0 | 0 | 3,288 | Read * note |
| Total | 18,176 | 59,989 | 523,960 | 240,992 | |
| Remaining capacity | 764,952 | ||||
* includes extant permissions and sites where development is on-going
** vacant land suitable for employment use in existing employment locations
Table 5: Completions (losses) and remaining potential losses by location in Belfast
| Location reference number | Location | Completed losses (m2) | Remaining potential losses (m2) | ||||
|---|---|---|---|---|---|---|---|
| 1 April 2024 to 31 March 2025 | 1 April 2023 to 31 March 2024 | 1 April 2022 to 31 March 2023 | 1 April 2021 to 31 March 2022 | Remaining commitments at 31 March 2025 | |||
| CC | City centre | 0 | 1,529 | 3,320 | 4,898 | 63,760 | |
| ML 08 | Kilwee Industrial Estate, Dunmurry | 0 | 0 | 0 | 0 | 0 | |
| BT 005/05 | Hillview Road | 0 | 0 | 0 | 0 | 0 | |
| BT 005/19 | Ballygomartin Industrial Estate, Ballygomartin Road | 0 | 0 | 0 | 0 | 0 | |
| BT 005/10 | Glenbank Business Park, Crumlin Road | 0 | 0 | 0 | 0 | 0 | |
| BT 005/25 | North Howard Link | 0 | 0 | 0 | 0 | 0 | |
| BT 005/15 | Kennedy Way | 0 | 0 | 0 | 0 | 0 | |
| BT 005/04 | Castlereagh Road | 0 | 0 | 0 | 0 | 0 | |
| MCH 09 | Prince Regent Road | 0 | 0 | 0 | 0 | 0 | |
| ML 07 | Springbank Industrial Estate | 0 | 0 | 0 | 0 | 0 | |
| BT 005/13 | Ravenhill Business Park | 0 | 0 | 0 | 0 | 0 | |
| BT 005/09 | Shore Road, Skegioneill Street | 0 | 0 | 0 | 0 | 93 | |
| BT 004 | Land at Springfield Road (former Mackie's site) | 0 | 0 | 0 | 0 | 0 | |
| BT 005/11 | Donegall Road | 0 | 0 | 0 | 0 | 0 | |
| BT 005/08 | Duncairn Gardens | 0 | 0 | 0 | 0 | 0 | |
| BHA 06 | Belfast Harbour | 0 | 0 | 0 | 0 | 0 | |
| BT 005/17 | Westlink Enterprise Centre, Distillery Street | 0 | 0 | 0 | 0 | 0 | |
| MCH 10 | Montgomery Road | 2,531 | 0 | 0 | 0 | 3,237 | |
| BT 005/20 | Lanark Way | 0 | 0 | 0 | 0 | 0 | |
| BT 005/07 | York Road including Jennymount Business Park | 0 | 0 | 0 | 0 | 0 | |
| BT 005/12 | Stockman's Way | 0 | 0 | 0 | 0 | 239 | |
| MCH 11 | Ballygowan Road | 0 | 0 | 0 | 0 | 0 | |
| BT 005/02 | Island Street, Ballymacarrett Road | 0 | 0 | 0 | 0 | 0 | |
| BT 005/21 | Argyle Business Park, Shankill Road | 0 | 0 | 0 | 0 | 0 | |
| BT 005/01 | Newtownards Road, Tamar Street | 0 | 0 | 0 | 0 | 956 | |
| BT 005/18 | Springfield Road | 0 | 0 | 0 | 0 | 4,429 | |
| BT 005/22 | Agnes Street Industrial Estate | 0 | 0 | 0 | 0 | 0 | |
| BT 005/03 | East Belfast Enterprise Park | 0 | 0 | 0 | 0 | 0 | |
| BT 005/23 | Louden Street, Townsend Street | 0 | 0 | 0 | 0 | 0 | |
| BT 005/16 | Whiterock Industrial Estate, Springfield Road | 0 | 0 | 0 | 0 | 271 | |
| BT 005/26 | Conway Street | 0 | 0 | 0 | 0 | 0 | |
| BT 005/06 | Cambrai Street | 0 | 0 | 0 | 0 | 12,497 | |
| BT 005/24 | Andrews Mill, Divis Street | 0 | 0 | 0 | 0 | 0 | |
| BT 005/14 | Glen Road | 0 | 0 | 0 | 0 | 148 | |
| ML 05 | Seymour Industrial Estate | 0 | 0 | 0 | 0 | 0 | |
| QOA | Queen's office area | 0 | 0 | 0 | 0 | 196 | |
| ROC | Rest of city | 0 | 0 | 0 | 0 | 20,228 | |
| Total | 3,134 | 2,457 | 3,826 | 4,898 | 106,054 | ||
Table 6: Mixed use sites remaining yield-capacity
| Zoning reference number | Location | Employment yield |
|---|---|---|
| BHA 05 | North Foreshore | 38,140 |
| BT 003 | Land at Crumlin Road including Girdwood Barracks | 20,000 |
| BT 002 | Land at Monagh Bypass, Upper Springfield Road | 4,030 |
| BHA 01 | Titanic Quarter | 62,989 |
| Total employment yield | 125,159 | |