Self-assessment of improvement objectives
When agreeing the five improvement objectives for 2023-24, council identified milestones and associated performance indicators to ensure achievement of the objectives and improvements that benefit residents, businesses, and other stakeholders. This section of the report firstly provides a summary of performance across the five improvement objectives, in Figure 4.
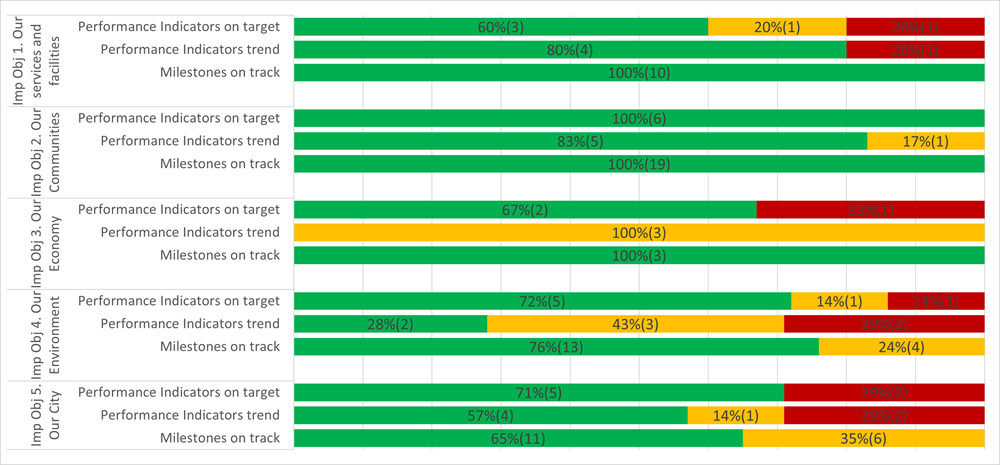
Figure 4: Summary of performance across the five improvement objectives.
|
Improvement objective 1: our services |
100 per cent of milestones were either achieved or partially achieved. |
Green |
|---|---|---|
|
3 (60 per cent) were on target or exceeded target (within 1 per cent or better). |
Green |
|
|
1 (20 per cent) was slightly adrift of target (between 1 per cent and 5 per cent). |
Amber |
|
|
1 (20 per cent) was adrift of target (5 per cent or more). |
Red |
|
|
4 (80 per cent) performance indicators showed positive change. |
Green |
|
|
1 (20 per cent) performance indicator showed negative change. |
Red |
|
|
Improvement objective 2: our communities |
100 per cent of milestones were either achieved or partially achieved. |
Green |
|
6 (100 per cent) were on target or exceeded target (within 1 per cent or better). |
Green |
|
|
5 (83 per cent) performance indicators showed positive change. |
Green |
|
|
1 (17 per cent) performance indicator showed no significant change or maintained a similar level of performance as per previous years. |
Amber |
|
|
Improvement objective 3: our economy |
3 (100 per cent) milestones were achieved. |
Green |
|
2 (67 per cent) were on target or exceeded target (within 1 per cent or better). |
Green |
|
|
1 (33 per cent) was adrift of target (5 per cent or more). |
Red |
|
|
3 (100 per cent) performance indicators showed no significant change or maintained a similar level of performance as previous years. |
Amber |
|
|
Improvement objective 4: our environment |
13 (76 per cent) milestones were achieved. |
Green |
|
4 (24 per cent) milestones were partially achieved. |
Amber |
|
|
5 (72 per cent) were on target or exceeded target (within 1 per cent or better) |
Green |
|
|
1 (14 per cent) was slightly adrift of target (between 1 per cent and 5 per cent) |
Amber |
|
|
1 (14 per cent) was adrift of target (5 per cent or more). |
Red |
|
|
2 (28 per cent) performance indicators showed a positive change |
Green |
|
|
3 (43 per cent) performance indicators showed no significant change or maintained a similar level of performance as previous years |
Amber |
|
|
2 (29 per cent) performance indicators showed a negative change. |
Red |
|
|
Improvement objective 5: our city |
11 (65 per cent) milestones were achieved. |
Green |
|
6 (35 per cent) milestones were partially achieved. |
Amber |
|
|
5 (71 per cent) were on target or exceeded target (within 1 per cent or better). |
Green |
|
|
2 (29 per cent) were adrift of target (5 per cent or more). |
Red |
|
|
4 (57 per cent) performance indicators showed positive change. |
Green |
|
|
1 (14 per cent) performance indicator showed no significant change. |
Amber |
|
|
2 (29 per cent) performance indicators showed a negative change. |
Red |
This is followed by a self-assessment of each improvement objective providing a progress update on the following areas:
- the achievement of the improvement objective;
- the achievement of the improvement milestones;
- how we performed – performance indicators (self-imposed and statutory), target and trends;
- how we compared – performance benchmarking (where relevant and available);
- additional evidence of performance improvement; and
- next steps.