5. Future uses
Methodology
Total DOA housing provision
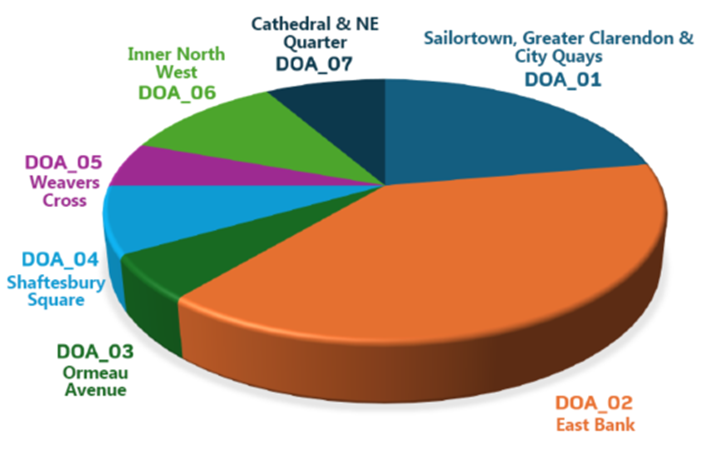
It is anticipated that the DOAs will contribute to around 85 per cent of city centre residential allocations over the plan period. This amounts to around 9,000 units or 40 per cent of total housing provision across the city. The pie chart illustrates the approximate spread of housing provision across all DOAs.
Policy HOU4 - Density of residential development
To ensure consistency across all DOAs, standardised density values have been applied to residential sites based on a range of contextual site criteria, the values of which have been derived from density bands within Plan Strategy Policy HOU4. The table highlights the methodology and rationale applied in deriving standardised densities to calculate approximate residential unit numbers on a site-by-site basis across each DOA. These are to be read in conjunction with density bands defined by Plan Strategy Policy HOU4 and have been informed by contextual site criteria.
Mixed use development
In addition to identifying residential sites, each DOA includes sites where a mix of uses are considered appropriate. For the purposes of this SPG, ‘mixed use development’ shall generally refer to these uses:
- Classes A1 or A2, shops or financial or professional services
- Classes B1 and B2, business and light industrial uses
- Class C1, dwelling houses
- Class C2, guest houses
- Class C3, residential institutions
- Class D1, community and cultural uses
- Hotels
Mitigating factors
The number of residential units specified in each DOA represents what can reasonably be anticipated to be delivered for the period up to 2035, having due regard to issues such as local context, patterns or scale of neighbouring buildings and the characteristics and constraints of each site (including topography, access and availability of infrastructure). The precise number of units that come forward within each DOA will ultimately be dependent on further evidence being provided at planning application stage, including site-specific assessments, the identification of any underlying site constraints and measures required to achieve quality residential environments.
Diagram illustrating general distribution of housing provision across all seven DOAs
The pie chart diagram shows the lion's share of housing provision is within DOA_02 East Bank.

Standardised densities table
This table outlines the five standardised densities used to calculate housing provision across all seven DOAs. Dwellings per hectare (DPH) are shown in columns 2 and 4.
| Contextualised site criteria | Standardised density value (minimum) | Equivalent Plan Strategy Policy HOU4 density bands | ||
|---|---|---|---|---|
| Settlement or character area | Average density band | Location criteria | ||
| Sites along secondary streets (adjacent to low-density housing) | 150 DPH (lower end) | Belfast city centre | 150 to 350 DPH | Within the defined city centre boundary |
| Sites along secondary streets (not adjacent to low-density housing) | 250 DPH (median) | Belfast city centre | 150 to 350 DPH | Within the defined city centre boundary |
| Sites with frontages onto primary routes | 350 DPH (upper end) | Belfast city centre | 150 to 350 DPH | Within the defined city centre boundary |
| Sites along or adjacent to city centre corridors | 450 DPH | Taller buildings within cit centre | Less than 350 DPH | Locations to be identified |
| Sites sutiable for standalone tall buildings | 600 DPH | Taller buildings within city centre | Less than 350 DPH | Locations to be identified |
