Summary tables
Table 1: Completions for monitor period 1 April 2022 - 31 March 2023
|
|
Office (B1A) |
Call centres (B1B) |
R & D (B1C) |
Light industry (B2) |
General Industry (B3) |
Storage & Distribution (B4) |
Total |
|||||||
|---|---|---|---|---|---|---|---|---|---|---|---|---|---|---|
|
|
Area (Ha) |
m2 |
Area (Ha) |
m2 |
Area (Ha) |
m2 |
Area (Ha) |
m2 |
Area (Ha) |
m2 |
Area (Ha) |
m2 |
Area (Ha) |
m2 |
|
Completed (gains) 01/04/2022- 31/03/2023 |
3.9 |
35,601 |
0.0 |
0.0 |
1.6 |
11,714 |
3.7 |
9,115 |
0.0 |
0.0 |
2.8 |
3,992 |
12 |
60,422 |
|
|
||||||||||||||
|
Completed (losses) 01/04/2022- 31/03/2023 |
0.2 |
2,640 |
0.0 |
0.0 |
0.0 |
0.0 |
0.0 |
0.0 |
0.0 |
0.0 |
0.1 |
1,186 |
0.2 |
3,826 |
|
Net Change |
3.7 |
32,961 |
0.0 |
0.0 |
1.6 |
11,714 |
3.7 |
9,115 |
0.0 |
0.0 |
2.7 |
2,806 |
11.8 |
56,596 |
|
|
Office (B1A) |
Call centres (B1B) |
R & D (B1C) |
Light industry (B2) |
General Industry (B3) |
Storage & Distribution (B4) |
Total |
|||||||
|---|---|---|---|---|---|---|---|---|---|---|---|---|---|---|
|
|
Area (Ha) |
m2 |
Area (Ha) |
m2 |
Area (Ha) |
m2 |
Area (Ha) |
m2 |
Area (Ha) |
m2 |
Area (Ha) |
m2 |
Area (Ha) |
m2 |
|
Completed (gains) 01/04/2021- 31/03/2023 |
11.3 |
62,656 |
0.0 |
0.0 |
1.6 |
11,714 |
3.7 |
9,115 |
0.0 |
0.0 |
3.2 |
4,284 |
20 |
87,769 |
|
Annual Average |
6 |
31,328 |
0.0 |
0.0 |
0.8 |
5,857 |
1.9 |
4,557.5 |
0.0 |
0.0 |
1.6 |
2,142 |
10 |
43,884.5 |
|
|
||||||||||||||
|
Completed (losses) 01/04/2021 - 31/03/2023 |
0.5 |
7,538 |
0.0 |
0.0 |
0.0 |
0.0 |
0.0 |
0.0 |
0.0 |
0.0 |
0.1 |
2,267 |
0.6 |
9,805 |
|
Annual Average |
0.3 |
3,769 |
0.0 |
0.0 |
0.0 |
0.0 |
0.0 |
0.0 |
0.0 |
0.0 |
0.1 |
1,133.5 |
0.3 |
4,902.5 |
|
Net Change |
11 |
55,118 |
0.0 |
0.0 |
1.6 |
11,714 |
3.7 |
9,115 |
0.0 |
0.0 |
3 |
2,017 |
19.3 |
77,964 |
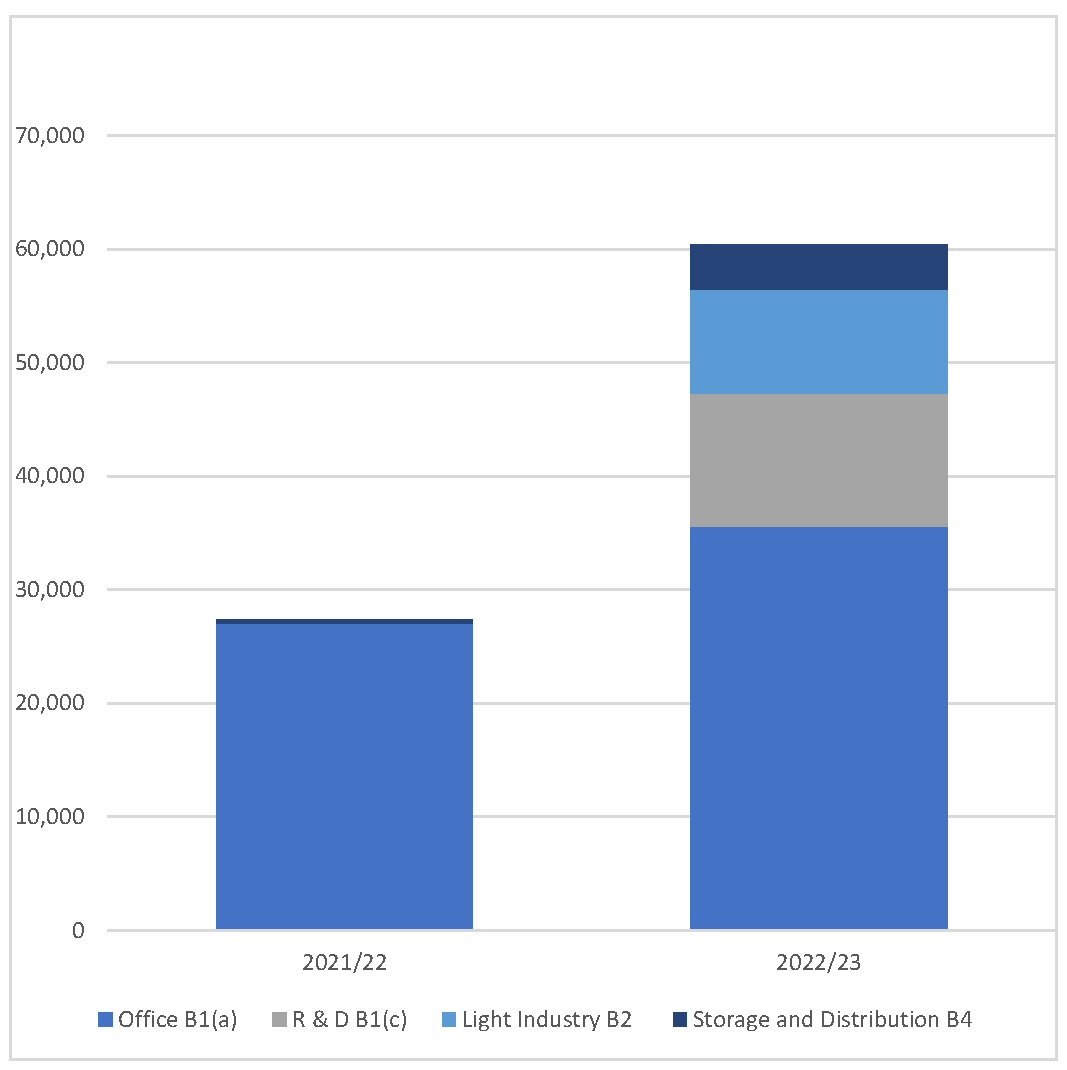
| Office B1(a) | R & D B1(c) | Light Industry B2 | Storage and Distribution B4 | |
|---|---|---|---|---|
| 2021 - 2022 | 27,055 | 0 | 0 | 292 |
| 2022 - 2023 | 35,601 | 11,714 | 9,115 | 3992 |
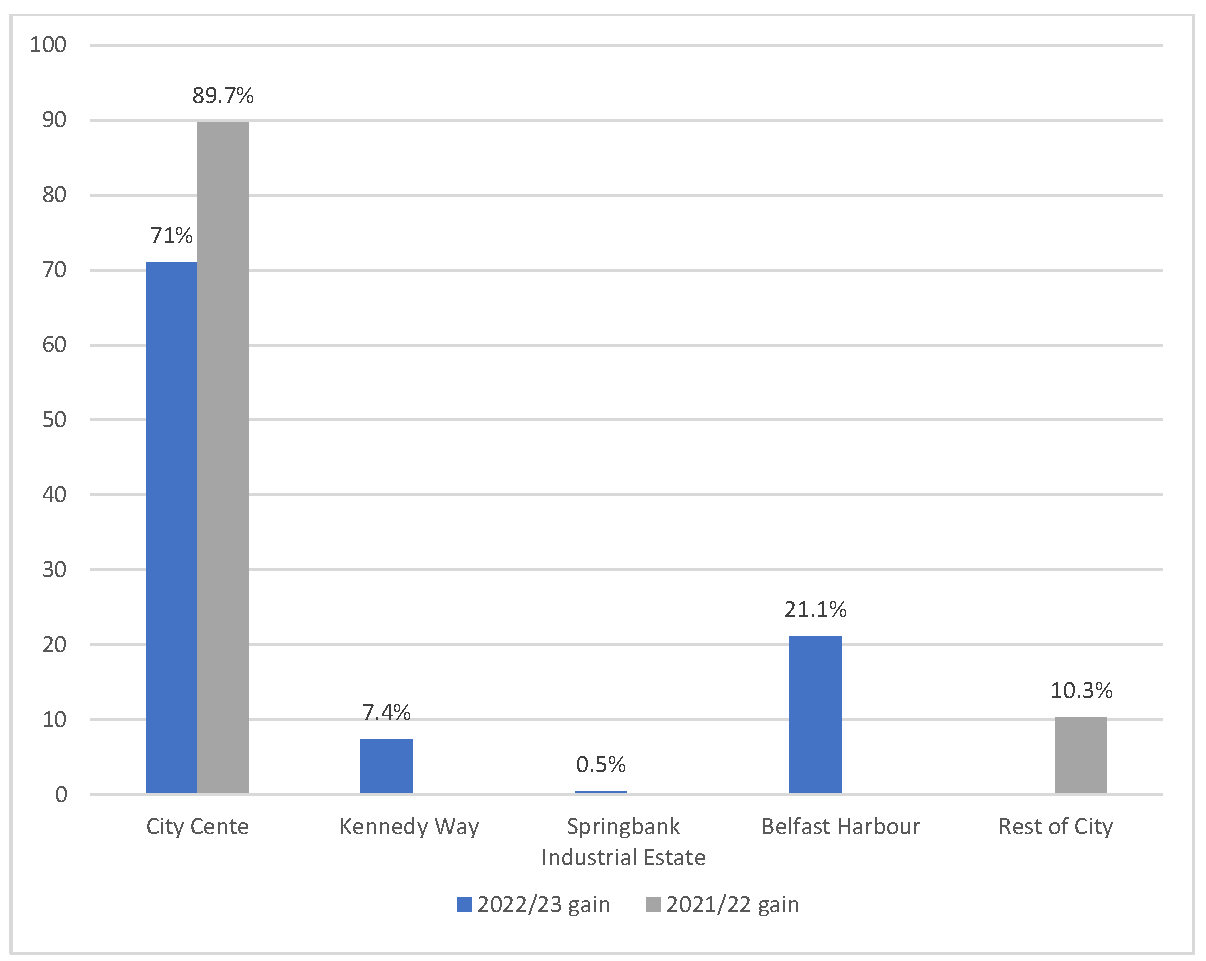
Figure 2: Completions (gains) by location across monitor periods 2021 - 2022 and 2022 - 2023 (per cent)
-min.png)
| 2022/23 gain | 2021/22 gain | |
|---|---|---|
| City Centre | 71.0 | 89.7 |
| Kennedy Way | 7.4 | |
| Springbank Industrial Estate | 0.5 | |
| Belfast Harbour | 21.1 | |
| Rest of City | 10.3 |
Table 3: Development under construction, extant permission (gain and losses)
|
|
Office (B1A) |
Call centres (B1B) |
R & D (B1C) |
Light industry (B2) |
General Industry (B3) |
Storage & Distribution (B4) |
Vacant employment land |
Total |
|||||||||||
|---|---|---|---|---|---|---|---|---|---|---|---|---|---|---|---|---|---|---|---|
|
|
Area (Ha) |
m2 |
Area (Ha) |
m2 |
Area (Ha) |
m2 |
Area (Ha) |
m2 |
Area (Ha) |
m2 |
Area (Ha) |
m2 |
Area (Ha) |
m2 |
Area (Ha) |
m2 |
|||
|
Development ongoing at 31/03/23 |
5.7 |
23,289 |
0.0 |
0.0 |
0.0 |
0.0 |
1 |
4,200 |
0.0 |
0.0 |
0.2 |
1,153 |
* |
* |
6.9 |
28,642 |
|||
|
Not started gains - Full & Outline 31/03/23 |
75.9 |
384,272 |
11.8 |
1,150 |
12.7 |
8,948 |
51.5 |
29,841 |
42.8 |
32,605 |
14.1 |
22,749 |
* |
* |
208.8 |
479,565 |
|||
|
Sub-total |
81.6 |
407,561 |
11.8 |
1,150 |
12.7 |
8,948 |
52.5 |
31,445 |
42.8 |
32,605 |
14.3 |
23,902 |
* |
* |
215.7 |
508,207 |
|||
|
|
|||||||||||||||||||
|
Losses not started at 31/03/23 |
4.8 |
25,728 |
0.1 |
1,868 |
0.1 |
381 |
2.8 |
10,638 |
2.4 |
6,800 |
10.6 |
26,964 |
0.7 |
2,844 |
21.5 |
75,223 |
|||
|
|
|||||||||||||||||||
|
Net Total |
76.8 |
381,833 |
11.7 |
-718 |
12.6 |
8,567 |
48.7 |
19,203 |
40.4 |
25,805 |
3.5 |
-4,215 |
-0.7 |
-2,844 |
203.2 |
419,018 |
|||
*For vacant employment land not covered by an existing planning consent please refer to table 4.
Table 4: Completions (gains) and remaining potential gains by location
| Completions (m2) | Remaining Capacity (m2) | ||||||||
|---|---|---|---|---|---|---|---|---|---|
| Ref No | Location | 01/04/2022 to 31/03/2023 | 01/04/2021 to 31/03/2022 | Remaining potential from extant permissions and under construction | Remaining potential from vacant developable land | ||||
| CC | City Centre | 32,741 | 26,987 | 319,772 | 0 | ||||
|
ML 08 |
KILWEE INDUSTRIAL ESTATE, DUNMURRY |
0 |
0 |
0 |
811 |
||||
|
BT 005/05 |
HILLVIEW ROAD |
0 |
0 |
3,543 |
1,416 |
||||
|
BT 005/19 |
BALLYGOMARTIN INDUSTRIAL ESTATE, BALLYGOMARTIN ROAD |
0 |
0 |
0 |
1,488 |
||||
|
BT 005/10 |
GLENBANK BUSINESS PARK, CRUMLIN ROAD |
0 |
0 |
0 |
11,988 |
||||
|
BT 005/25 |
NORTH HOWARD LINK |
0 |
0 |
0 |
0 |
||||
|
BT 005/15 |
KENNEDY WAY |
3,438 |
68 |
1,258 |
0 |
||||
|
BT 005/04 |
CASTLEREAGH ROAD |
0 |
0 |
0 |
2,423 |
||||
|
MCH 09 |
PRINCE REGENT ROAD |
0 |
0 |
4,412 |
0 |
||||
|
ML 07 |
SPRINGBANK INDUSTRIAL ESTATE |
221 |
0 |
1,606 |
35,199 |
||||
|
BT 005/13 |
RAVENHILL BUSINESS PARK |
0 |
0 |
0 |
0 |
||||
|
BT 005/09 |
SHORE ROAD/SKEGIONEILL STREET |
0 |
0 |
0 |
629 |
||||
|
BT 004 |
LAND AT SPRINGFIELD ROAD (FORMER MACKIE'S SITE) |
0 |
0 |
0 |
50,782 |
||||
|
BT 005/11 |
DONEGALL ROAD |
0 |
0 |
0 |
0 |
||||
|
BT 005/08 |
DUNCAIRN GARDENS |
0 |
0 |
1,618 |
0 |
||||
|
BHA 06 |
BELFAST HARBOUR |
9,932 |
0 |
47,287 |
183,727 |
||||
|
BT 005/17 |
WESTLINK ENTERPRISE CENTRE, DISTILLERY STREET |
0 |
0 |
0 |
1,281 |
||||
|
MCH 10 |
MONTGOMERY ROAD |
0 |
0 |
10,919 |
0 |
||||
|
BT 005/20 |
LANARK WAY |
0 |
0 |
0 |
641 |
||||
|
BT 005/07 |
YORK ROAD INCLUDING JENNYMOUNT BUSINESS PARK |
0 |
0 |
563 |
0 |
||||
|
BT 005/12 |
STOCKMANS WAY |
0 |
292 |
44 |
0 |
||||
|
MCH 11 |
BALLYGOWAN ROAD |
0 |
0 |
0 |
0 |
||||
|
BT 005/02 |
ISLAND STREET/BALLYMACARRETT ROAD |
0 |
0 |
0 |
331 |
||||
|
BT 005/21 |
ARGYLE BUSINESS PARK, SHANKILL ROAD |
0 |
0 |
0 |
0 |
||||
|
BT 005/01 |
NEWTOWNARDS ROAD/TAMAR STEET |
0 |
0 |
0 |
0 |
||||
|
BT 005/18 |
SPRINGFIELD ROAD |
0 |
0 |
4,310 |
5,107 |
||||
|
BT 005/22 |
AGNES STREET INDUSTRIAL ESTATE |
0 |
0 |
456 |
0 |
||||
|
BT 005/03 |
EAST BELFAST ENTERPRISE PARK |
0 |
0 |
0 |
0 |
||||
|
BT 005/23 |
LOUDEN STREET/TOWNSEND STREET |
0 |
0 |
0 |
0 |
||||
|
BT 005/16 |
WHITEROCK INDUSTRIAL ESTATE, SPRINGFIELD ROAD |
0 |
0 |
13,177 |
6,652 |
||||
|
BT 005/26 |
CONWAY STREET |
0 |
0 |
0 |
0 |
||||
|
BT 005/06 |
CAMBRAI STREET |
0 |
0 |
310 |
0 |
||||
|
BT 005/24 |
ANDREWS MILL, DIVIS STREET |
0 |
0 |
0 |
0 |
||||
|
BT 005/14 |
GLEN ROAD |
0 |
0 |
20 |
0 |
||||
|
ML 05 |
SEYMOUR INDUSTRIAL ESTATE |
0 |
0 |
0 |
3,598 |
||||
|
ROC |
Rest of City |
0 |
0 |
17,913 |
0 |
||||
|
BHA 01 |
TITANIC QUARTER |
14,080 |
0 |
* |
* |
||||
|
ODL |
Outside Development Limit |
0 |
0 |
3,288 |
0 |
||||
|
Total |
60,412 |
27,347 |
430,496 |
306,073 |
|||||
| Total | 736,569 | ||||||||
*See Table 6 for remaining capacity at BHA 01 Titanic Quarter.
Table 5: Completions (losses) and remaining potential losses by location
| Completed losses (m2) | Remaining potential losses (m2) | ||||
|---|---|---|---|---|---|
|
Ref No |
Location |
01/04/2022 - 31/03/2023 |
01/04/2021 - 31/03/2022 |
Remaining commitments at 31/03/2023 |
|
| CC | City Centre | 3,320 | 4,898 | 27,043 | |
|
ML 08 |
KILWEE INDUSTRIAL ESTATE, DUNMURRY |
0 |
0 |
0 |
|
|
BT 005/05 |
HILLVIEW ROAD |
0 |
0 |
5,028 |
|
|
BT 005/19 |
BALLYGOMARTIN INDUSTRIAL ESTATE, BALLYGOMARTIN ROAD |
0 |
0 |
0 |
|
|
BT 005/10 |
GLENBANK BUSINESS PARK, CRUMLIN ROAD |
0 |
0 |
0 |
|
|
BT 005/25 |
NORTH HOWARD LINK |
0 |
0 |
0 |
|
|
BT 005/15 |
KENNEDY WAY |
0 |
0 |
0 |
|
|
BT 005/04 |
CASTLEREAGH ROAD |
0 |
0 |
0 |
|
|
MCH 09 |
PRINCE REGENT ROAD |
0 |
0 |
800 |
|
|
ML 07 |
SPRINGBANK INDUSTRIAL ESTATE |
0 |
0 |
0 |
|
|
BT 005/13 |
RAVENHILL BUSINESS PARK |
0 |
0 |
93 |
|
|
BT 005/09 |
SHORE ROAD/SKEGIONEILL STREET |
0 |
0 |
0 |
|
|
BT 004 |
LAND AT SPRINGFIELD ROAD (FORMER MACKIE'S SITE) |
0 |
0 |
0 |
|
|
BT 005/11 |
DONEGALL ROAD |
0 |
0 |
0 |
|
|
BT 005/08 |
DUNCAIRN GARDENS |
0 |
0 |
381 |
|
|
BHA 06 |
BELFAST HARBOUR |
0 |
0 |
5,129 |
|
|
BT 005/17 |
WESTLINK ENTERPRISE CENTRE, DISTILLERY STREET |
0 |
0 |
0 |
|
|
MCH 10 |
MONTGOMERY ROAD |
0 |
0 |
2,531 |
|
|
BT 005/20 |
LANARK WAY |
0 |
0 |
0 |
|
|
BT 005/07 |
YORK ROAD INCLUDING JENNYMOUNT BUSINESS PARK |
0 |
0 |
0 |
|
|
BT 005/12 |
STOCKMANS WAY |
0 |
0 |
561 |
|
|
MCH 11 |
BALLYGOWAN ROAD |
0 |
0 |
0 |
|
|
BT 005/02 |
ISLAND STREET/BALLYMACARRETT ROAD |
0 |
0 |
0 |
|
|
BT 005/21 |
ARGYLE BUSINESS PARK, SHANKILL ROAD |
0 |
0 |
0 |
|
|
BT 005/01 |
NEWTOWNARDS ROAD/TAMAR STEET |
0 |
0 |
956 |
|
|
BT 005/18 |
SPRINGFIELD ROAD |
0 |
0 |
3,940 |
|
|
BT 005/22 |
AGNES STREET INDUSTRIAL ESTATE |
0 |
0 |
0 |
|
|
BT 005/03 |
EAST BELFAST ENTERPRISE PARK |
0 |
0 |
0 |
|
|
BT 005/23 |
LOUDEN STREET/TOWNSEND STREET |
0 |
0 |
0 |
|
|
BT 005/16 |
WHITEROCK INDUSTRIAL ESTATE, SPRINGFIELD ROAD |
0 |
0 |
271 |
|
|
BT 005/26 |
CONWAY STREET |
0 |
0 |
0 |
|
|
BT 005/06 |
CAMBRAI STREET |
0 |
0 |
1,672 |
|
|
BT 005/24 |
ANDREWS MILL, DIVIS STREET |
0 |
0 |
0 |
|
|
BT 005/14 |
GLEN ROAD |
0 |
0 |
0 |
|
|
ML 05 |
SEYMOUR INDUSTRIAL ESTATE |
0 |
0 |
0 |
|
|
ROC |
Rest of City |
506 |
0 |
27,723 |
|
|
|
Total |
3,826 |
4,898 |
76,128 |
|
Table 6: Mixed use sites remaining yield/capacity
|
ZONING REFERENCE |
LOCATION |
EMPLOYMENT YIELD |
|---|---|---|
|
BHA 05 |
NORTH FORESHORE |
38,140 |
|
BT 003 |
LAND AT CRUMLIN ROAD INCLUDING GIRDWOOD BARRACKS |
20,000 |
|
BT 002 |
LAND AT MONAGH BYPASS / UPPER SPRINGFIELD ROAD |
4,030 |
|
BHA 01 |
TITANIC QUARTER |
62,989 |
|
TOTAL |
125,159 |
Appendix A: Summary Methodology
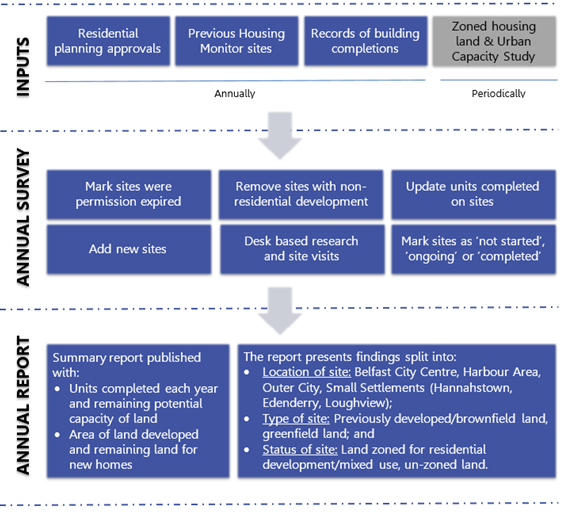
The employment land monitor measures net gains and losses in employment floorspace within the Belfast City Council area. It provides a snapshot of the amount of land available for employment as of 1st April each year. The Monitor demonstrates the presence of an adequate and continuous supply of employment land in the city and provides evidence to inform the preparation of the Local Development Plan and to make planning decisions. The Monitor presents a register of potential employment land, based on current planning policy designations and planning permissions, rather than an accurate picture of viable employment land.
An Urban Capacity Study will be undertaken from time to time to assess the suitability, availability and achievability of monitored sites to ensure the land required to facilitate the required jobs growth over the plan period is met. An Urban Capacity Study for Belfast was published in March 2018. (https://www.belfastcity.gov.uk/getmedia/3794156e-b2b5-4437-ab36-2f13f2f4f742/DPS028_Evi-05.pdf)
|
Inputs |
|||
|---|---|---|---|
|
Employment planning approvals |
Loss of employment approvals |
Records of building completions |
Zoned housing land and Urban Capacity Study |
|
Annually |
Periodically |
||
| Annual Survey | ||
|---|---|---|
| Add new sites | Update floorspace commenced | Update floorspace completed |
| Remove sites were permission expired | Desk based research and site visits | Mark sites as 'not started', 'ongoing' or 'completed' |
| Annual Report | |
|---|---|
Summary report published with:
|
The report presents findings split into:
|