Published online January 2022
Contents
1. Introduction
The Strategic Planning Policy Statement (SPPS) for NI (September 2015) outlines a ‘plan, monitor and manage’ approach to ensure that, as a minimum, a 5 year supply of land for housing is maintained. It states that monitoring should be an ongoing process with annual reporting and review. As a minimum, it states that monitoring must include:
- The housing land supply at the beginning and end of the annual reporting period;
- The number of net additional units built during the annual reporting period; and
- The number of net additional housing units built in the period since adoption of the local plan.
The primary purpose of the Housing Land Availability Monitor (referred to as the ‘Housing Monitor’) is to inform the formulation of the Council’s new Local Development Plan (LDP). However, it will also help the Council identify where a shortfall in potential land supply might exist and can inform house-builders on the availability of land that may be suitable for housing.
The information collated will allow a clear view of the overall progress in meeting the housing objectives of the existing development plan and in identifying issues likely to require intervention. For example, a need to release phased housing sites in order to maintain a 5 year supply of available housing land, or the release of a site providing for a particular housing need.
The Planning Act (NI) 2011 requires Belfast City Council to make an annual report to the Department for Infrastructure outlining the extent to which the objectives set out in the LDP are being achieved. As the Council are currently preparing the first new LDP for Belfast under this new legislation, the production of Annual Monitoring Reports has not yet commenced. Instead, annual Housing Monitor reports are being published by the Council until the new LDP is adopted.
2. Methodology
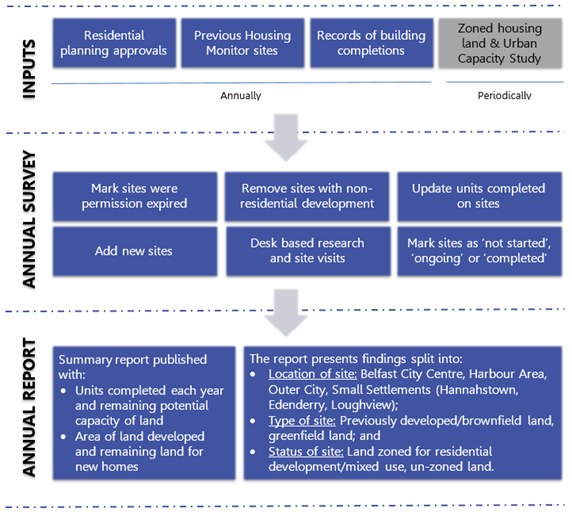
The Housing Land Availability Monitor (the “Monitor”) measures net gains in housing within the Belfast City Council boundary. It provides a snapshot of the amount of land available for new homes as of 1 April each year. The process followed to produce the Annual Housing Monitor is summarised at Appendix A.
The Monitor presents a register of potential housing land, based on current planning policy designations [Footnote 1] and planning permissions, rather than an accurate picture of viable housing land. It is the role of an Urban Capacity Study (UCS), which will be undertaken from time to time, to assess the suitability, availability and achievability of monitored sites to contribute to a viable supply of land. The most recent UCS [Footnote 2] was completed in March 2018 and, although new sites identified are not included in the Monitor, the outcomes are summarised within the 2017/2018 Belfast Housing Land Availability Summary Report.
3. Summary Tables and Graphs
The following summary tables detail the supply of housing for the Belfast district from 1 April 2021 to 31 March 2022 and provide a snapshot of the land remaining for housing and its associated potential capacity to accommodate new homes. Cumulative totals are also provided since the Council’s housing monitor was established – i.e. 1 April 2015, the date at which the Council gained statutory responsibility for planning.
It should be noted that these cumulative totals will reflect the total since the Council gained statutory responsibility for planning until such time as an up-to-date Local Development Plan for the new district is adopted, establishing appropriate targets to monitor delivery against.
3.1 Settlement Summary
Table 1 provides a breakdown of the housing supply, land availability and capacity for future housing units for each Settlement within the District, including Belfast City and the Small Settlements of Edenderry, Hannahstown and Loughview.
Belfast City is then further sub-divided into a number of settlement areas or sectors based on key designations within the prevailing development plan. These areas include Belfast City Centre, the Belfast Harbour Estate and Outer Belfast, which is defined as the area covered by the Settlement Limit of Belfast City outside of the City Centre and Harbour Area.
The data within the table is divided into the following columns:
- Area Developed 1 April 2021 to 31 March 2022 – the area of land in hectares (ha) developed during the current monitor year;
- Area Developed 1 April 2015 to 31 March 2022 – the cumulative area of land in hectares (ha) developed to date from 1 April 2015 (the date at which the Council gained statutory responsibility for planning);
- Units Complete 1 April 2021 to 31 March 2022 – the number of dwellings completed during the current monitor year;
- Units Complete 1 April 2015 to 31 March 2022 – the cumulative total number of dwellings completed to date from 1 April 2015 (the date at which the Council gained statutory responsibility for planning);
- Available Potential (Hectares) – the area of land estimated as available for additional dwelling completions within monitored sites as at 31 March 2022; and
- Available Potential (Dwelling Units) – the estimated number of dwellings that could be accommodated on the available potential land as at 31 March 2022.
During the 2021/22 monitoring year 754 units were completed on 20.2 ha of land across the District. 353.4 ha of land remains, with potential capacity for 21,288 units. Within Belfast City, 731 units completed were within Outer Belfast, with a further 23 units completed within the City Centre. 11,974 of the available potential units are within Outer Belfast, whilst 6,152 and 3,138 potential dwelling units remain in the City Centre and Harbour Area respectively. There were no completions in Edenderry, Hannahstown or Loughview with a total of 24 potential dwelling units available across these three Small Settlements.
Note – Hectare values may not tally due to rounding
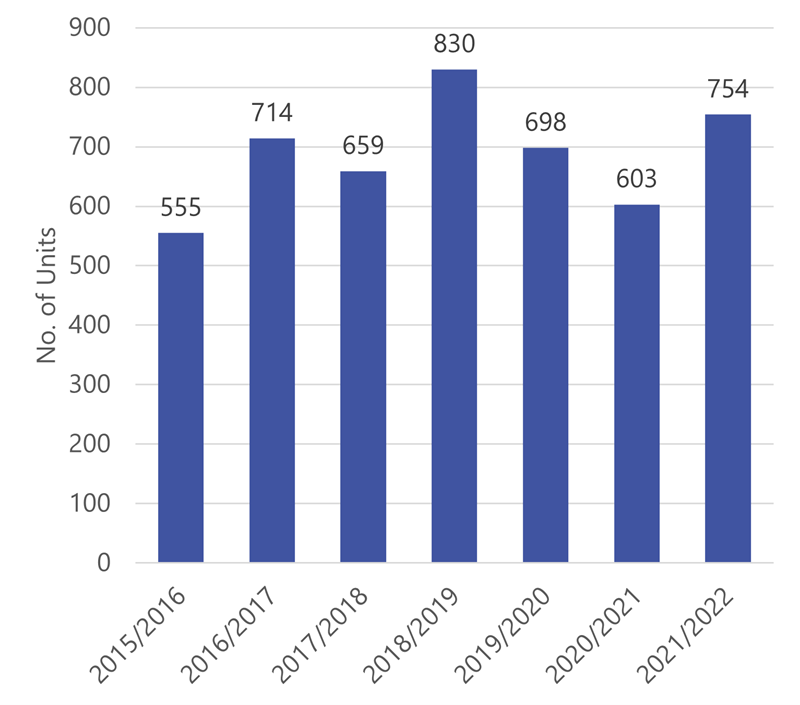
Figure 1 shows the total dwellings completed for the district from 2015/16 to present, to allow for an analysis of trends over a longer timeframe. The total number of dwellings completed in the district has increased by 25.0 per cent from 603 in 2020/21 to 754 in the current monitor year.
Figure 1: Total Dwellings Completed 2015-2022
3.2 Urban Footprint Summary
Table 2 provides a breakdown of the housing supply, land availability and capacity for future housing units within Belfast City, further categorised into land within the identified ‘Urban Footprint' [Footnote 3 ]or Greenfield land. This only refers to Belfast City, given that the Urban Footprint is only defined in relation to settlements with a population greater than 5,000 people. This excludes Belfast’s three Small Settlements.
In addition to the columns as described in Table 1 above, the Units within the Urban Footprint ( per cent) row calculates the proportion of dwellings completed within the Urban Footprint during the current monitor year and the cumulative total number of dwellings completed to date from 1 April 2015 (the date at which the Council gained statutory responsibility for planning), expressed as a percentage of the total number of dwellings completed over the respective time periods.
84.5 per cent of the 754 units completed within Belfast City were built on land within the Urban Footprint. Of the remaining potential dwelling units, 95.4 per cent are within the Urban Footprint.
|
Settlement / Area |
Area Developed (Hectares) |
Units Complete |
Available Potential (Hectares) |
Available Potential (Dwelling Units) |
|||
|---|---|---|---|---|---|---|---|
| 01-04-21 to 31-03-22 | 01-04-15 to 31-03-22 | 01-04-21 to 31-03-22 | 01-04-15 to 31-03-22 | ||||
|
Urban Footprint |
14.5 |
91.2 |
637 |
4.045 |
312.5 |
20,278 |
|
|
Units within the Urban Footprint ( per cent) |
- |
- |
84.5 per cent |
84.4 per cent |
- |
95.4 per cent |
|
|
Greenfield |
5.7 |
36.3 |
117 |
745 |
39.6 |
986 |
|
|
Belfast City Total |
20.2 |
127.4 |
754 |
4,790 |
352.0 |
21,264 |
|
Note – Hectare values may not tally due to rounding
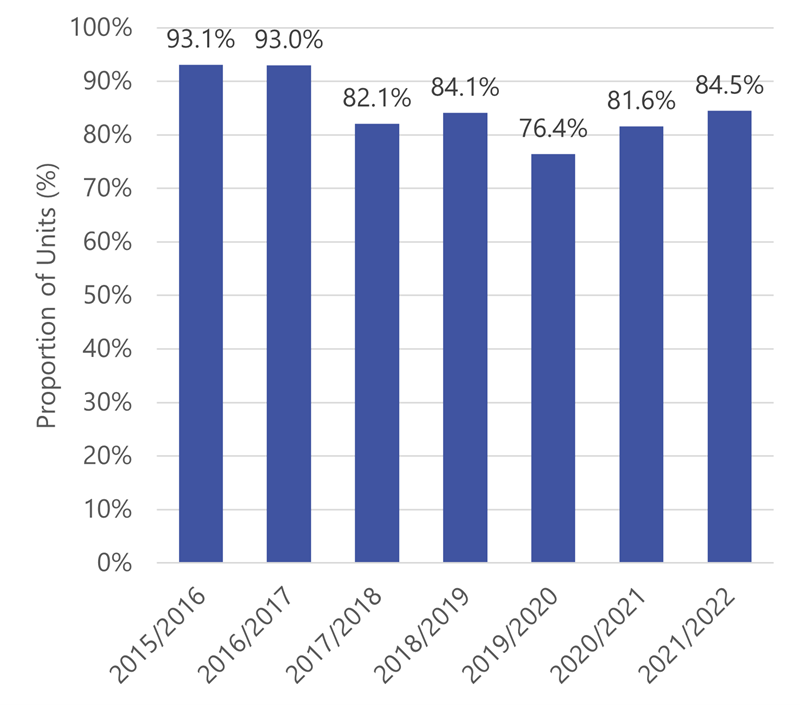
Figure 2 shows the proportion of dwellings within the Urban Footprint for the district from 2015/16 to present, to allow for an analysis of trends over a longer timeframe. The proportion of dwellings completed within the Urban Footprint has increased from 81.6 per cent in 2020/21 to 84.5 per cent in the current monitor year.
Figure 2: Proportion of Dwellings Within the Urban Footprint 2015-2022
3.3 Land Use Zoning Summary
Table 3 provides a breakdown of the dwelling units completed by type of land use zoning within the prevailing development plan within each settlement or settlement area. The data within this table is divided into the following columns:
- Land Zoned for Housing – the number of units completed and the remaining potential units on land allocated for residential use within the prevailing development plan;
- Land Zoned for Mixed Use – the number of units completed and the remaining potential units on land zoned for mixed use development, which includes an element of residential development within key site requirements;
- All other land – the number of units completed and the remaining potential units on any other land not falling within the first two, which include non-zoned land and land zoned for non-residential uses; and
- Proportion of Zoned Land ( per cent) – the proportion of units completed on either housing or mixed use zoned land expressed as a percentage of the total number of dwellings completed.
36.3 per cent of the dwelling units completed during 2021/22 have been delivered on zoned land within Belfast City. The number of units completed on all other land was 480 dwellings.
| Units complete | ||||||||||
|---|---|---|---|---|---|---|---|---|---|---|
|
Settlement / Area |
Land Zoned for Housing |
Land Zoned for Mixed Use |
All other land |
Total |
Proportion on Zoned Land ( per cent) |
|||||
|
01-04-21 to 31-03-22 |
01-04-15 to 31-03-22 |
01-04-21 to 31-03-22 |
01-04-15 to 31-03-22 |
01-04-21 to 31-03-22 |
01-04-15 to 31-03-22 |
01-04-21 to 31-03-22 |
01-04-15 to 31-03-22 |
01-04-21 to 31-03-22 |
01-04-15 to 31-03-22 |
|
|
Outer Belfast |
267 |
1,334 |
0 |
60 |
464 |
3,033 |
731 |
4,427 |
36.5 per cent |
31.5 per cent |
|
City Centre |
7 |
37 |
n/a |
n/a |
16 |
326 |
23 |
363 |
30.4 per cent |
10.2 per cent |
|
Harbour Area |
n/a |
n/a |
0 |
0 |
0 |
0 |
0 |
0 |
0.0 per cent |
0.0 per cent |
|
Belfast Total |
274 |
1,371 |
0 |
60 |
480 |
3,359 |
754 |
4,790 |
36.3 per cent |
29.9 per cent |
|
Small Settlements |
||||||||||
|
Edenderry |
n/a |
n/a |
n/a |
n/a |
0 |
0 |
0 |
0 |
n/a |
n/a |
|
Hannahstown |
n/a |
n/a |
n/a |
n/a |
0 |
23 |
0 |
23 |
n/a |
n/a |
|
Loughview |
n/a |
n/a |
n/a |
n/a |
0 |
0 |
0 |
0 |
n/a |
n/a |
|
Small Settlement Total |
n/a |
n/a |
n/a |
n/a |
0 |
23 |
0 |
23 |
n/a |
n/a |
|
District Total |
274 |
1,371 |
0 |
60 |
480 |
3,382 |
754 |
4,813 |
36.3 per cent |
29.7 per cent |
Figure 3 shows the proportion of units completed for the district on both housing or mixed use zoned land expressed as a percentage of the total number of dwellings completed from 2015/16 to present. This proportion has increased from 29.0 per cent in 2020/21 to 36.3 per cent in the current monitor year. Figure 4 shows the total number of units completed on all other land. This ‘windfall’ provision has increased by 12.1 per cent from 428 units in 2020/21 to 480 in the current monitor year.
Figure 3: Proportion of Units Complete on Zoned land 2015-2022
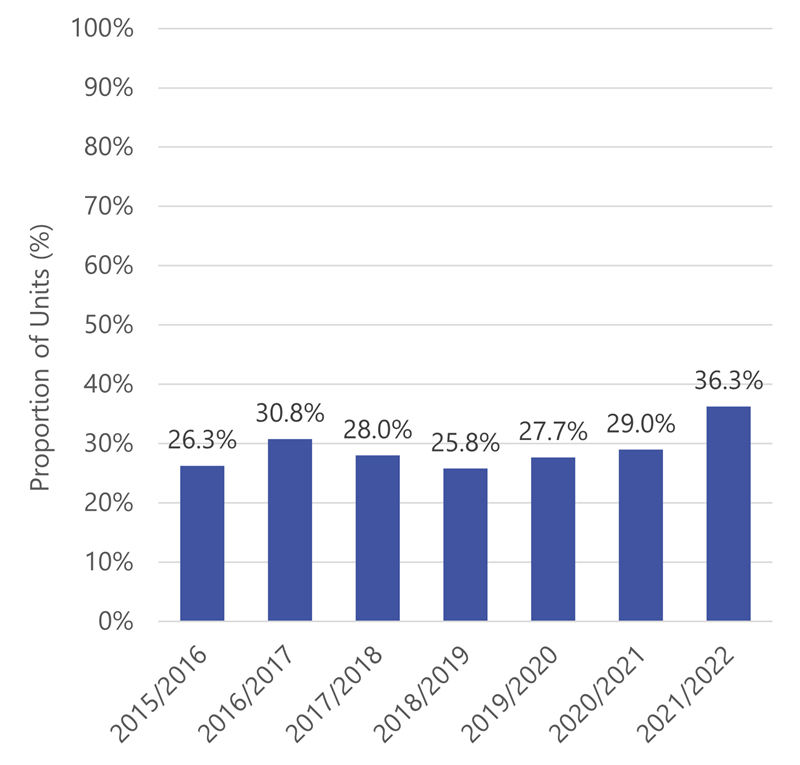
Figure 4: No. of Units Complete on All Other Land 2015-2022
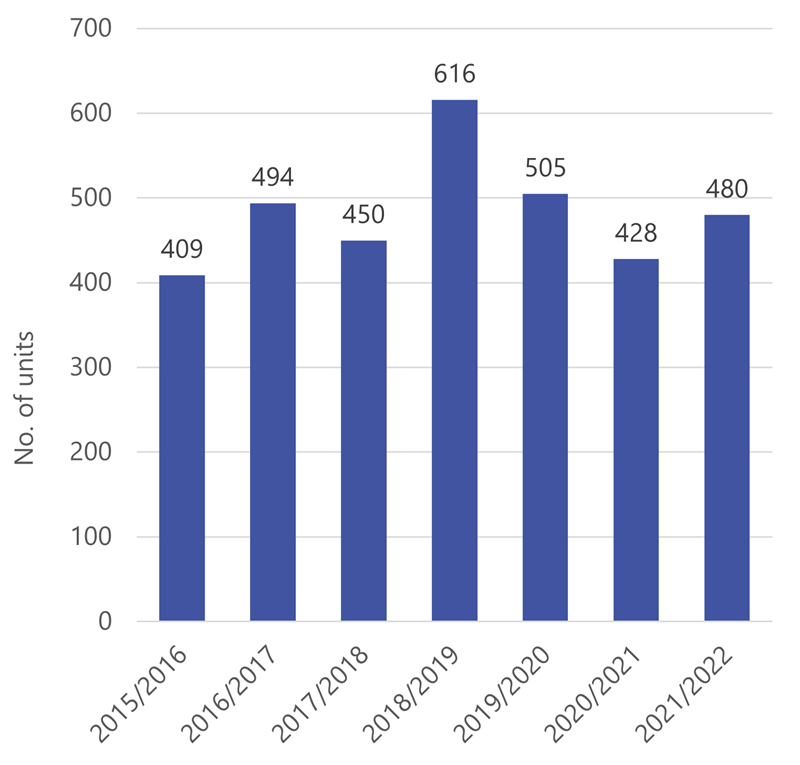
Table 4 provides details of the capacity for future dwelling units on the same basis as Table 3. Of the remaining potential available for future dwellings, 35.4 per cent is currently zoned for housing or mixed use. 3,854 of the available 21,288 potential dwelling units can be delivered on land zoned for housing and 3,678 units on land zoned for mixed use. In comparison, 13,756 of the remaining potential units can be provided on all other land.
|
Settlement / Area |
Remaining Potential Units |
||||
|---|---|---|---|---|---|
|
Land Zoned for Housing |
Land Zoned for Mixed Use |
All other land |
Total |
Proportion on Zoned Land ( per cent) |
|
|
Belfast City |
|||||
|
Outer Belfast |
3,135 |
653 |
8,186 |
11,974 |
31.6 per cent |
|
City Centre |
719 |
n/a |
5,433 |
6,152 |
11.7 per cent |
|
Harbour Area |
n/a |
3,025 |
113 |
3,138 |
96.4 per cent |
|
Belfast City Total |
3,854 |
3,678 |
13,732 |
21,264 |
35.4 per cent |
|
Small Settlements |
|||||
|
Edenderry |
n/a |
n/a |
21 |
21 |
n/a |
|
Hannahstown |
n/a |
n/a |
2 |
2 |
n/a |
|
Loughview |
n/a |
n/a |
1 |
1 |
n/a |
|
Small Settlement Total |
n/a |
n/a |
24 |
24 |
n/a |
|
District Total |
3,854 |
3,678 |
13,756 |
21,288 |
35.4 per cent |
Appendix A: Summary Methodology
The Housing Land Availability Monitor measures net gains in housing within the Belfast City Council area. It provides a snapshot of the amount of land available for new homes as of 1 April each year. The Monitor demonstrates the presence of an adequate and continuous supply of housing land in the city and provides evidence to inform the preparation of the Local Development Plan and to make planning decisions.
The Monitor presents a register of potential housing land, based on current planning policy designations and planning permissions, rather than an accurate picture of viable housing land. An Urban Capacity Study will be undertaken from time to time to assess the suitability, availability and achievability of monitored sites to contribute to a viable 5 year supply of land. An Urban Capacity Study for Belfast was published in March 2018.
Footnotes
[Footnote 1] For the purposes of the Housing Land Availability Monitor, the draft Belfast Metropolitan Area Plan (BMAP) 2015 is utilised rather than the former Belfast Urban Area Plan (BUAP) 2001.The adopted BMAP was quashed as a result of a judgement in the Court of Appeal delivered on 18 May 2017 and, although this means the BUAP is now the statutory development plan for the area, the draft BMAP, in its most recent, pre-examination, form remains a significant material consideration in future planning decisions. Draft BMAP therefore refers to that which was purported to be adopted and not the pre-examination draft published in 2004.
[Footnote 2] Belfast City Council Urban Capacity Study – Final, 20 March 2018
[Footnote 3] The Urban Footprint is defined within the Regional Development Strategy 2035 as “the continuous built-up area of the settlement”. The Urban Footprint boundary was updated as part of the UCS (March, 2018) as explained in the 2017/2018 Belfast Housing Land Availability Summary Report. The 2018 Urban Footprint forms a revised baseline position for the 2017/2018 monitor period onwards.