Published: August 2023
Consultation
This EQIA report has been prepared primarily for the purposes of consultation. All comments are welcome and will be accepted in any format. The consultation period will last for a period of 12 weeks from 7 August to 24 October 2023.
The Council will arrange and facilitate:
- one public consultation event to be held at City Hall on 5 September at 6.30pm
- one public event, targeted towards equality organisations, to be held at City Hall on 6 September 2pm
- two online public consultation events on 20 September at 7pm and 21 September at 3pm
Submit all comments to:
EQIA - Belfast Agenda
Community Planning
Telephone: 02890 320202
Email: [email protected]
Textphone: 028 9027 0405
SignVideo: www.belfastcity.gov.uk/contact
The deadline for comments is 12 noon on 30 October 2023.
If there is any information in this report which is not clear, or if you require further information, contact the Council Officer on the above number or email. All relevant documents can be accessed on the Council’s website at yoursay.belfastcity.gov.uk/draft-belfast-agenda
Access to information
As part of our commitment to promoting equality of opportunity and good relations, we want to ensure that everyone is able to access the documents we produce. We would therefore be happy to provide any of the information in this document in alternative formats on request. If you have any queries about this document, and its availability in alternative formats (including Braille, disk and audio cassette and in minority languages to meet the needs of those who are not fluent in English) then contact:
Community Planning
Belfast City Council
Belfast City Hall
Donegal Street North, BT1 5GS
Contact Number: 028 9032 0202
Email: [email protected]
Contents
- 1. Introduction
- 2. Background to the policy
- 3. Definition of the aims of the policy
- 4. Relevant Belfast City Council strategies
- 5. Other relevant research
- 6. Analysis of available data
- 7. Assessment of impacts
- 8. Consideration of measures
- 9. Consultation
- 10. Further steps
- Appendix 1: Organisations engaged in stage 1 pre-consultation
- Appendix 2: Organisations engaged in stage 2 pre-consultation
- Appendix 3: Belfast’s population by Section 75 dimension
1. Introduction
Section 75 of the Northern Ireland Act 1998 requires all public authorities, in carrying out their functions in Northern Ireland, to have due regard to the need to promote equality of opportunity
- between persons of different religious belief, political opinion, racial group, age, marital status or sexual orientation
- between men and women generally
- between persons with a disability and persons without and
- between persons with dependants and persons without.
In addition, without prejudice to these obligations, public authorities must, in carrying out their functions in Northern Ireland, have regard to the desirability of promoting good relations between persons of different religious beliefs, political opinion or racial group.
The Disability Discrimination (NI) Order 2006 further introduced new duties requiring all public authorities in carrying out their functions relating to Northern Ireland to have due regard to the need to
- promote positive attitudes towards disabled people and
- encourage participation by disabled people in public life.
About equality impact assessments
Schedule 9 of the Northern Ireland Act sets out the detailed procedure for the implementation of Section 75 duties including the conduct of screening exercises and equality impact assessments (EQIAs).
An EQIA is a thorough and systematic analysis of a policy to determine the extent of differential impact upon the groups within the nine equality categories and whether that impact is adverse. If it is decided that the policy has an adverse impact on one or more of the nine equality categories, public authorities must consider measures which may mitigate the adverse impact and alternative ways of delivering policy aims which have a less adverse impact on the relevant equality category.
According to the Equality Commission NI’s (ECNI) Practical Guidance on Equality Impact Assessment (2004), an EQIA should take seven steps.
| Step 1 | Defining the aims of the policy |
|---|---|
| Step 2 | Consideration of available data and research |
| Step 3 | Assessment of impacts |
| Step 4 | Consideration of:
|
| Step 5 | Consultation |
| Step 6 | Decision by the Council and publication of results of the EQIA |
| Step 7 | Monitoring for adverse impact in the future and publication of the results of the monitoring |
This EQIA has closely followed ECNI’s Practical Guidance. Steps 1 to 4 have been completed and are detailed in this report.
Purpose of this EQIA
This draft EQIA report sets out how Belfast City Council and its partners intend to promote equality of opportunity and good relations through the implementation of the Belfast Agenda 2023–2027 strategy and action plans.
The EQIA is conducted at a strategic level addressing the Belfast Agenda 2023-2027 in a holistic way and does not include details of the equality impacts of every individual element within the community plan. The issues identified in this EQIA will act as a guide to community planning partners when they are developing projects or programmes under the Belfast Agenda, and each project or programme will be subject to separate equality assessment under the Northern Ireland Act 1998, as appropriate.
The purpose of this EQIA is to:
- consider the potential equality and good relations impacts of the Belfast Agenda at a strategic level, focusing on key inequalities which the community plan can help to reduce
- provide an outline analysis of data and research on current major inequalities experienced by people in the Section 75 groups in relation to the key commitments under the Belfast Agenda
- establish the positive equality impacts which the Belfast Agenda can make in order to provide guidance to the Council and its community planning partners for the development and implementation of individual programmes and projects
It is intended that this draft report will form the basis for formal consultation with Belfast City Council’s Equality Scheme consultees, other interested stakeholders and the general public. A further final decision report, giving due regard to the comments made during consultation, will then be prepared for the consideration of the Council.
2. Background to the policy
The Belfast Agenda 2017–2021
The Local Government Act (Northern Ireland) 2014 introduced the new statutory duty of community planning. It is a process by which local councils and community planning partners jointly plan for making long-term improvements in economic, social and environmental wellbeing.
In reference to improving the social wellbeing of a district, the Act explicitly includes promoting equality of opportunity and the desirability of promoting good relations in accordance with Section 75 of the Northern Ireland Act 1998.
Community planning partnerships must produce a community plan every four years.
Following an extensive period of engagement and consultation, Belfast City Council published the Belfast Agenda, the city’s first community plan, in November 2017. As well as outlining priorities for action over the next four years, it set out a joint vision and long-term ambitions for Belfast’s future, including desired outcomes that by 2035, Belfast would be a city:
- where everyone benefits from a thriving and prosperous economy
- that is safe, fair and inclusive for all
- that is vibrant, attractive, connected and environmentally sustainable
- where everyone experiences good health and wellbeing
- where everyone fulfils their potential
Community planning partners
In addition to Belfast City Council, the community planning partners are:
- Belfast Chamber
- Belfast Health and Social Care Trust
- Belfast Metropolitan College
- CBI Northern Ireland
- Council for Catholic Maintained Schools
- Eastside Partnership
- Education Authority
- Forward South Partnership
- Greater Shankill Partnership
- Health and Social Care – Strategic Planning and Performance Group
- Invest NI
- Libraries NI
- Queen’s University Belfast
- Northern Ireland Fire and Rescue Service
- Northern Ireland Housing Executive
- Police Service of Northern Ireland (PSNI)
- Public Health Agency
- South Eastern Health and Social Care Trust
- Sport NI
- Tourism NI
- Ulster University
- VCSESectoral Advisory Panel
- Visit Belfast
- West Belfast Partnership - Páirtíocht Feirste Thiar
VCSE Sectoral Advisory Panel
A voluntary, community and social enterprise (VCSE) sectoral advisory panel has been established in Belfast. The panel’s aims are:
- to ensure that the sector’s voices are represented as part of the community planning process
- to develop and improve cross sectoral relationships and partnerships
- to promote effective community engagement
Panel members include representation from the following organisations:
- Ashton Community Trust
- Save the Children
- East Belfast Community Development Agency
- British Red Cross
- Barnardo’s NI
- GEMS NI
- Belfast Hills Partnership
- Lower Ormeau Residents' Action Group
- Belfast Healthy Cities
- Action Mental Health
- Orchardville
- Upper Andersonstown Community Forum
- Include Youth
- Women’s Resource and Development Agency
- Blackie River Community Group
- Community Foundation for NI
- West Belfast Strategic Health Forum
Continuing the Conversation: Belfast Agenda 2023–2027 refresh
In 2021, the Council and its community planning partners began the process of reviewing and refreshing the Belfast Agenda. As well as a legislative requirement, this provided an opportunity to re-engage with partners and citizens.
Stage 1 pre-consultation of the refresh
The first stage of the refresh included:
- six workshops engaging 130 participants including Belfast City Council elected representatives, community organisations, other key stakeholders and interested members of the public (see Appendix 1)
- an online survey that was completed by 50 respondents
- a hardcopy survey that was distributed through libraries and community centres and completed by 385 respondents
- specific engagements with older people through the Greater Belfast Seniors’ Forum (G6) and Healthy Ageing Strategic Partnership
- specific engagements with children and young people including through training providers, sports clubs and schools
During this engagement, the long-term vision and ambitions of the Belfast Agenda were tested on stakeholders and found to be still relevant.
The community planning partnership then produced an overarching framework comprising 4 thematic areas (Our people and communities, Our economy, Our place and Our environment), 10 strategic priorities and 4 cross-cutting priorities. It incorporated the following changes as a result of the phase 1 pre-consultation.
- Strategic priority of Economic recovery was changed to Sustainable and inclusive economic growth
- Anti-poverty was introduced as a cross-cutting priority alongside inclusive growth
- The need for regeneration to be connected to local communities and inclusive of minority communities was built into the action plan engagement process around the development of area plans
- Loneliness and isolation were introduced as key areas of focus within health inequalities and older people priorities
The following diagrams summarise the changes made to the draft Belfast Agenda before and after phase 1 pre-consultation.
Figure 1: Strategic priorities and cross-cutting themes before phase 1 pre-consultation

Figure 2: Strategic priorities and cross-cutting themes after phase 1 pre-consultation
Draft action plans were then produced for each theme and priority.
Stage 2 pre-consultation of the refresh
During the second stage of the refresh, the draft action plans were published on Belfast City Council’s Your Say platform, where participants could comment using online discussion forums. The draft action plans were also tested at 10 workshops that involved 176 participants including Belfast City Council elected representatives, community organisations, other key stakeholders and interested members of the public (see Appendix 2).
All participants were asked to specifically consider equality issues and opportunities (‘How can we help everybody benefit from the Belfast Agenda?’) during workshop discussions, and at an equality, diversity and inclusion-themed workshop in City Hall, participants were further asked to consider:
- the opportunities, challenges or barriers that specific groups of people face, and
- any gaps or equality and diversity issues that we should consider moving forward.
The following summarises some of the changes resulting from stage 2 pre-consultation.
- Place-based planning will be inclusive of communities of geography and identity
- There will be greater linkages between the health inequalities, older people and good relations actions plans at implementation.
- Age-related inequalities will consider vulnerability to frailty and falls
- Requirements of LGBTQ+ people in relation to sport will be considered as part of a whole-systems approach to physical activity and nutrition
- Targets have been amended in relation to children with SEN (special educational needs)
- A target has been introduced to reduce the disability employment gap
- Actions are being developed to support low-paid workers
- A baseline has been established for the real living wage target
- Language has been changed in relation to minority ethnic communities. The Belfast Racial Equality and Inclusion Forum (working title) will take forward feedback relating to training in English for speakers of other languages (ESOL)
- There will be further coordination with community planning, the Belfast Racial Equality and Inclusion Forum, the Executive Office and voluntary partners with regards to support for refugees or those seeking asylum
- A leadership programme for minority ethnic community leaders will be included in plans, to help and empower others
- An action to develop Belfast as a JAM-friendly (Just a Minute) [Footnote 1] city has been included
- The significance of the digital divide will be included and actions are being developed to support digital inclusion and innovation
- Stretch goals will be agreed in relation to child poverty in particular
Final stage
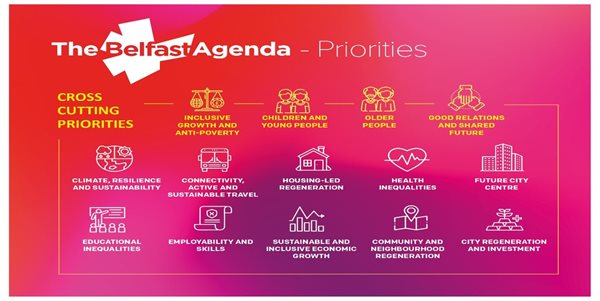
The final stage of the refresh will be public consultation on the updated draft Belfast Agenda strategy and action plans, which are arranged under five themes and 15 priorities (see figure 3).
The final draft strategy and action plans will be reviewed taking in to account the findings of the public consultation and published.
3. Definition of the aims of the policy
Vision
The Belfast Agenda 2023–2027 is Belfast’s second community plan. It is a high-level framework outlining how the Council and its community planning partners will work collaboratively to deliver a vision of better quality of life for all citizens in Belfast. The vision states that by 2035:
‘Belfast will be a city re-imagined and resurgent. A great place to live and work for everyone. Beautiful, well connected and culturally vibrant, it will be a sustainable city shared and loved by all its citizens, free from the legacy of conflict. A compassionate city offering opportunities for everyone. A confident and successful city energising a dynamic and prosperous city region. A magnet for talent and business and admired around the world. A city people dream to visit.’
Outcomes
The desired outcomes that the Belfast Agenda is working towards are:
- Belfast will be a city where everyone benefits from a thriving and prosperous economy
- Belfast will be a city that is a welcoming, safe, fair and inclusive city for all
- Belfast will be a city where everyone in Belfast fulfils their potential
- Belfast will be a city where everyone in Belfast experiences good health and wellbeing
- Belfast will be a city that is vibrant, attractive, connected and environmentally sustainable
Ambitions
The draft Belfast Agenda also identifies five over-arching ambitions or targets that will be used to measure success in 2035, namely:
- Our city is home to an additional 66,000 people.
- Our economy supports 46,000 additional jobs.
- There will be a 33 per cent reduction in the life expectancy gap between the most and least deprived neighbourhoods.
- Every young person leaving school has a destination that fulfils their potential.
- Our carbon emissions will be reduced by 80 per cent.
Themes and priorities
Medium-term priorities that the draft Belfast Agenda identifies as the focus for the next four years (2023 - 2027) are arranged under five themes: Our people and communities, Our economy, Our place, Our planet and Compassionate City. Each theme has between one and four priorities (see figure 3).

Figure 3: Draft Belfast Agenda themes and priorities
For each priority, the draft strategy summarises the need for intervention, intended areas of work and measures of success.
Compassionate City
Compassionate City is a cross-cutting theme that aims to make Belfast ‘a caring, fair, and inclusive place to live [where] the most vulnerable people in our society are considered in all aspects of our planning and delivery’. Its priorities include:
- Inclusive growth and anti-poverty
- Good relations and shared future, including peace building and addressing challenges faced by people from minoritized ethnic backgrounds
- Older people, including at-risk and isolated older people
- Children and young people including early years
Action plans
Each priority also has a draft action plan that details:
- Strategic intent: What are we trying to do?
- Actions: How are we going to achieve it?
- Stretch goals: How will we measure success in 2027?
- Partners: Who is going to do it?
Actions are at different stages of development: some are initial concepts requiring further development; others are already in progress. Given the high-level strategic focus of the draft Belfast Agenda 2023–2027, the equality impacts of individual actions are not specifically considered as part of this EQIA. Rather each programme or project will be subject to equality screening in line with the Council’s and/or its partners’ Equality Scheme and in accordance with the criteria set out in the guidance produced by ECNI.
Enablers
The draft Belfast Agenda also identifies five enablers that will create the conditions in which the Belfast Agenda can be achieved. These are:
- Accountability: clear accountability for delivery through our city governance. Working together to deliver shared city outcomes and being subject to public accountability.
- Aligning our collective funding to city outcomes and accessing national and regional funding opportunities.
- Maximise use of resources and assets to deliver collaborative gains and outcomes for the city and our people.
- Partnership working: to maximise the opportunities for all through strong established partnerships including, e.g., Community Planning, Belfast Region City Deal and VCSE Panel.
- City leadership which is empowered to place-shape local economies and communities.
- Ensuring alignment with Local Development Plan (LDP) 2035 which will facilitate growth by coordinating public and private investment to encourage development where it can be of most benefit to the wellbeing of the community and environment.
4. Relevant Belfast City Council strategies
This section considers a range of Belfast City Council strategies that have bearing on the draft Belfast Agenda.
Corporate Plan
Belfast City Council’s Corporate Plan (2020 - 2024) supports the Belfast Agenda through its themes of:
- Growing the economy
- Living here
- Working and learning
- City development
- Resilience and sustainability
- Cross-cutting priorities, including implementing the Good Relations Strategy
It also introduces a number of organisational capabilities required to deliver excellent service and city leadership. Priorities under organisational capabilities include data development, people development, customer focus, continuous improvement and equality, diversity and inclusion.
The Local Development Plan
The Local Development Plan (LDP, adopted May 2023) for Belfast sets out the Council’s aspirations for the future physical development and growth of the city and the policies that will be used in assessing future planning applications. There is a statutory link between the community plan and the LDP, so the LDP supports the Belfast Agenda’s vision and outcomes to enable the sustainable spatial growth and development of the city.
Equality Scheme
The council’s Equality Scheme (approved in 2015) sets out the Council’s arrangements for complying with the equality duties under Section 75 of the Northern Ireland Act 1998. It includes a commitment to provide information in alternative formats on request where reasonably practicable. The Scheme states that alternative formats may include Easy Read, Braille, audio formats (CD, mp3 or DAISY), large print or minority languages to meet the needs of those for whom English is not their first language.
Language Strategy
Belfast City Council’s 2018 Language Strategy aspires to create a place where linguistic diversity is celebrated and respected. It has two key purposes.
- To protect and promote awareness of our indigenous languages of Irish and Ulster-Scots
- To promote access to, inclusion of and awareness of other languages including sign languages, the languages of new communities who live in Belfast and languages and communication for disabled people
Good Relations Strategy
The Council’s Good Relations Strategy was adopted in 2019. It, ‘aims to promote sharing over separation and the economic, social and environmental benefits of such.’ It also sets down the five outcomes it seeks to achieve.
- Outcome one: Strong, positive and transformative civic leadership – inclusive governance with community changemakers
- Outcome two: Shared and connected spaces – a smart, connected city driven by inclusive and transformative place making
- Outcome three: Shared Services – focusing on co-design and social innovation
- Outcome four: Structured collaboration and partnerships
- Outcome five: An intercultural city and respectful cultural expression within the rule of law
Inclusive Growth Strategy
The Inclusive Growth Strategy (2020) aims to connect all residents with economic growth and ensure that everyone can succeed including by ‘doing all we can to eradicate poverty and inequality in our city’. It outlines the Council’s commitment to adopting business practices that support inclusive growth, such as inclusive recruitment and social value procurement, while engaging with partners to also adopt inclusive growth principles and practices in their work. There is a particular focus on ‘cohorts’ of people including residents not in employment and young people not in education, employment or training.
Draft Belfast Economic Strategy 2022–2030
Belfast City Council is currently developing an economic strategy for Belfast. Its aim is to support the Council’s sustainable and inclusive growth ambitions for the city, maximising return on investment to benefit all residents with a focus on priority technologies such as digital and creative industries, financial services, life and health sciences and advanced manufacturing and engineering.
Belfast Region City Deal
The Belfast Region City Deal (BRCD) is a bespoke package of investment from central government and BRCD partners [Footnote 2] of more than £850 million. Its vision is:
‘Inclusive economic growth that delivers more and better jobs, a positive impact on the most deprived communities and a balanced spread of benefits across the region’.
It is targeted to generate up to 20,000 jobs over the next 10 to 15 years while further strengthening growth sectors such as life and health sciences, the digital and creative industries and advanced manufacturing.
Resilience Strategy
Published in 2020, the Resilience Strategy is the city’s first climate plan. It sets out 30 transformational programmes to transition Belfast to an inclusive, zero-emissions, climate-resilient economy within a generation and provides a framework to safeguard Belfast against situations that could threaten its safety and stability over coming years.
Belfast: Our Recovery
The Belfast: Our Recovery plan was published in September 2020. It sets out short-term priorities to drive city recovery from the immediate impacts of the Covid-19 pandemic while also building the foundations for sustained recovery and growth. Its pillars include:
- Our digital innovation: We will invest in our digital infrastructure to facilitate job creation and attract talent, entrepreneurs and investors to the city.
- Our city: We will provide leadership to future proof and ensure the safe use of public spaces and seek to sustain Belfast’s social and cultural infrastructure.
- Our services: We will consider and adapt our services accordingly in the short and longer term.
- Our communities: We will understand community needs and strengths and support collective local action.
- Our economy: We will invest and work with city partners to protect and create jobs and support Belfast residents to access much needed employment.
- Our environment: We will decarbonise our economy; creating jobs, protecting our communities, improving health and wellbeing and enhancing the liveability of our city.
A Bolder Vision
A Bolder Vision outlines a vision to transform the city centre. It was developed collectively by Belfast City Council, the Department for Infrastructure (DfI) and the Department for Communities (DfC) with broad stakeholder input.
To achieve the inclusive growth ambitions described within the Belfast Agenda, the city centre is considered a principal driver in securing investment and creating jobs. A Bolder Vision outlines how a radical approach is needed to address underlying challenges and to reimagine how the city centre works.
City Centre Regeneration and Investment Strategy
Published in 2015, the City Centre Regeneration and Investment Strategy recognises that Belfast:
‘city centre is one of the most important places in Northern Ireland. [It is] where investment impact can be maximised, where rates are generated and where momentum can be built to support growth in the surrounding neighbourhoods.’
A City Imagining
A City Imagining, Belfast City Council’s cultural strategy for 2020 - 2030, places culture and creativity at the heart of civic development. There are four themes within the strategy.
- A City Belonging (active participation): Priorities under this theme will support citizens to be active agents of change and co-creators of cultural activity.
- A City Challenging (diversity): Priorities under this theme will aspire to cultivate creative environments for dynamic co-creation and synergy in our placemaking.
- A City Creating (new approaches): Priorities under this theme will facilitate and explore new ways of working, taking more risks and helping artists to have more autonomy to engage with citizens in new and creative ways.
- A City Exploring (our place in the world): Priorities under this theme will sustain, strengthen and develop the city’s cultural ecosystem.
Age-friendly Belfast Plan 2022–2026
Belfast’s four-year plan for ageing well was developed with older people and older peoples’ groups in the city. It identifies four thematic areas of focus:
- Infrastructure – helping people to get out and about
- Social inclusion – promoting social connections
- Health and wellbeing – promoting opportunities to be healthy, active and included
- Financial security – supporting people to manage the increasing costs of living.
Consultation and Engagement Framework
Belfast City Council’s Consultation and Engagement Framework describes a broad spectrum of two-way communication (from consultation to engagement to involvement) between the Council and its residents and stakeholders. It recognises that effective dialogue helps make decisions, policies and services that are better suited to the people they are intended to benefit.
5. Other relevant research
Consultation on the Belfast Agenda 2017–2021
Belfast City Council carried out an EQIA on the draft 2017–2021 Belfast Agenda. At the end of the public consultation, eight responses were received specifically on the EQIA. The Council found that ‘Generally, respondents welcomed the Belfast Agenda and felt that it was likely to have a positive impact on all Section 75 groups [and] There was also general agreement with the EQIA’s findings and conclusions.’ Other feedback highlighted:
- the importance of building equality implications into the implementation of the Belfast Agenda. The ability to achieve our desired ambitions will be dependent on a greater understanding of inequalities at the programming and operational level to ensure that programmes have the desired positive impact and do not result in a negative impact on others.
- the importance of evidence and information to inform planning and decision making was also highlighted. Whilst the need for more detailed analysis and understanding of equality impacts at the programming level was seen as essential, further attention on inequalities at the population level was also required.
- equality implications in relation to housing need and availability, specifically in relation to north Belfast.
- the need to measure the positive impact of the Belfast Agenda on people and to ensure that proactive steps are taken to achieve the desired impact for all people.
ECNI response to the consultation on the draft Belfast Agenda
In response to the public consultation on the 2017–2021 community plan, ECNI stated that:
‘The Equality Commission welcomes Belfast City Council’s efforts to mainstream the Section 75 equality and good relations duties into the development of the Belfast Agenda. We also welcome that the Council has conducted an equality impact assessment of the Belfast Agenda at a strategic level, and that it is committed to further equality screening and EQIAs, as necessary, of the programmes and projects which are developed to help achieve the aims and desired outcomes of the Belfast Agenda.’
It then recommended that Belfast City Council consider the following in relation to the draft Belfast Agenda.
- In relation to the vision, it recommended that it should:
- Include a high-level commitment to address key inequalities experienced by the Section 75 equality groups, as well as to promote good relations
- make clear that the promotion of equality of opportunity and good relations are cross-cutting themes within the strategy and are central to achieving economic growth and prosperity
- include a clear commitment to ensure compliance with the UK Government’s obligations under international human rights conventions, including the UN Convention on the Rights of Persons with Disabilities
- In relation to monitoring and evaluation:
- ‘Crucially, it essential that all of these high-level commitments are underpinned by the inclusion of robust outcome focused action measures and are capable of being measured through the proposed indicator framework.’
- It recommends that all relevant Belfast agenda measures are not only tracked in aggregate but also for the impact on individuals from each of the Section 75 grounds
- In relation to the draft EQIA, ECNI recommended consideration of the following:
- Greater input of statutory partners into the EQIA, particularly relating to gathering evidence, assessment of impacts and establishing Section 75 monitoring mechanisms.
- Consideration of some further evidence and setting the evidence base out by functional area (in addition to by Section 75 group) in order to assist with prioritisation of addressing inequalities and identifying gaps in data.
- In relation to mitigation/alternative policies, the EQIA should highlight what changes are/will be made to the Belfast Agenda as a result of undertaking the EQIA
- The final EQIA report should indicate what Section 75 monitoring mechanisms will be put in place.
- Commitment to considering the establishment of a fifth equality work stream focusing on equality data development, analysis and Section 75 monitoring
- Ensure alignment of the Belfast Agenda and EQIA, in particular with the Council’s Local Development Plan and EQIA.
- Ensure the Council’s Section 75 obligations are integrated within the outcomes-based accountability approach.
Belfast Agenda 2017–2021 Stage 7 Monitoring Report
In line with ECNI guidance, a Stage 7 monitoring report was completed on the Belfast Agenda 2017–2021. The purpose of monitoring policies which have been subjected to EQIA is to determine whether the impacts predicted, particularly those which may have an adverse impact on anyone in the Section 75 equality categories, have occurred in practice, and whether the impacts are greater or lesser than anticipated.
The Stage 7 monitoring report found that
‘Currently, we are not aware of any specific instances or impacts raised in relation to particular aspects of the agenda. We continue to believe that the proposed actions will contribute positively to the promotion of equality of opportunity but will continue to monitor the policies and evaluate the results of monitoring at regular intervals.’
Findings from stage 1 pre-consultation on the 2023–2027 refresh
The report on Stage 1 of the pre-consultation on the refresh of the Belfast Agenda notes that participants were motivated to take part in the consultation to give greater say to communities and residents and ensuring that engagement was inclusive to all communities, particularly minority ethnic communities, young people and the LGBTQIA+ community.
97 per cent of workshop participants[Footnote 3] and 74 per cent of hardcopy survey respondents felt that the Belfast Agenda 2017–21’s long-term vision and outcomes were still relevant and meaningful. [Footnote 4] Participants also broadly agreed with the existing priorities.
Participants identified ‘Minority communities’ as a new priority, specifically:
‘Participants discussed structural inequalities and the disproportionate impact of COVID, social exclusion, poverty and educational attainment on minority ethnic, migrant, and the LGBTQ+ communities. They expressed concern about how effectively the voices of these communities were being heard in the community planning process.’
Similarly, in relation to a proposed new priority of ‘Public engagement and inclusion’:
‘Participants discussed the importance of ordinary people having a say in the community plan, through better citizen engagement. They felt ensuring that “less-heard” from groups were given opportunities to get involved in decision making, and that participatory democracy in the city was deepened and strengthened.’
At a workshop targeted at communities of interest, the report notes that minority communities
‘discussed the need to be sensitive to cultural differences when engaging with minority communities, and to build this consideration into engagement. The also highlighted the need for a targeted focus on vulnerable minority groups to ensure that the community plan relates to their needs.’
In relation to young people, it was noted that children and young people need a greater voice in the Belfast Agenda starting from early years. Young people were identified as a priority group in relation to employability and skills, while the Covid-19 pandemic had highlighted digital inequalities, in particular in relation to educational attainment.
Placemaking was considered particularly important for making the city welcoming and safe for young people and the LGBTQ+ community.
Older people were felt to have been disproportionately affected by the Covid pandemic but ‘reported that they couldn't see themselves in the Belfast Agenda’. Priorities identified going forward included:
- Addressing health inequalities and access to health services, particularly waiting lists
- Loneliness and Isolation particularly in relation to access to the city centre and opportunities to re-engage socially. It was felt that this had a direct impact on mental health.
Several participants expressed concern about families and older people who were struggling with poverty, which was seen as an important underpinning issue that was not sufficiently acknowledged.
Several consultees would also welcome further focus on good relations and peace building.
Findings from stage 2 pre-consultation on the 2023–27 refresh
The report on stage 2 of the pre-consultation on the refresh of the Belfast Agenda notes high levels of good will towards the engagement process and the Belfast Agenda with a number of groups, including Section 75 representative groups, indicating that they would be keen to continue to be involved in its design and delivery.
Other key findings included:
- Participants welcomed that the plan did not look at equality through the lens of the two traditional religious communities within the city. However, they felt the focus should be further defined and extended to recognise the wide range of vulnerable people and groups that live in Belfast.
- Overall, consultees felt that the Children and young people action plan lacked goals and detailed actions. They felt that there should be greater reflection of the impact of poverty and the cost-of-living crisis on children and families. It was also noted that young people did not take part in the in-room consultations. Several consultees suggested that further youth engagement could be done through their groups and networks.
- In relation to the Good relations and shared future priority, many participants highlighted the absence of any reference or focus on peace walls and felt that the paramilitarism, sectarianism and racism should be explicitly named and challenged. Some people felt there could be greater focus on language and culture. Concerns were raised in relation to those people with refugee status or seeking asylum being subject to bias that impacts employment, housing and quality of life.
- Consultees were generally supportive of the action plan relating to the older people priority, however highlighted the need to consider how older people can be supported to re-enter the job market if they wished to do so.
- In relation to the Sustainable and inclusive economic growth priority, some participants felt there should be more of a focus on supporting access to economic and employment opportunities, particularly for disabled people, carers and for those living in more deprived parts of the city.
- Participants generally agreed with the draft educational inequalities action plan. They raised the importance of focusing on early years support and the need to provide children and young people the best start in life. It was highlighted that not all young people have an equal start in life with many dealing with social and personal circumstances including disabilities, those who may have experienced trauma, those who are neurodiverse or young people who may live in areas of high deprivation.
- Childcare was identified as a major barrier for women, single parents and low-income workers in relation to the Inclusive growth and anti-poverty priority.
- Some consultees felt that there should be actions to support and encourage lifelong learning with a reference to women, people with a first language other than English or Irish and people with refugee status or seeking asylum.
- In relation to Connectivity, active and sustainable travel, participants highlighted potential barriers to public transport and active travel experienced by specific groups including disabled people, older people, people with limited mobility (including wheelchair users and mobility scooter users), parents with prams and buggies and newcomers (due to different language abilities and lack of knowledge about services and geographies).
- Some participants would welcome reference to the Irish language, recognising the positive contribution it makes to the city and supporting Irish-medium education, employment and cultural tourism.
6. Analysis of available data
Theme 1: Our people and communities
Health inequalities
Religious background/political opinion
According to 2021-2022 Department of Health statistics:
- 74 per cent of people of Catholic religion rate their health as good or very good
- 70 per cent of people of Protestant religion rate their health as good or very good
- 78 per cent of people of none or other religion (including missing and refused data) rate their health as good or very good [Footnote 5]
Ethnic background
On Census Day 2011 across NI, people from minority ethnic backgrounds, including Asian (90 per cent), Black (90.4 per cent) or Mixed (92.6 per cent) reported considerably higher rates of good or very good health than the white population (79.3 per cent). The only exception was the Traveller ethnic group: only 66.3 per cent reported that they were in good or very good health. [Footnote 6]
It is generally accepted that factors causing certain diseases and ill health are more prevalent among certain ethnic groups. The 2011 Census also identified, for example, that diabetes is more prevalent in Asian and Black ethnic groups compared to the general NI population. [Footnote 7]
According to Belfast City Council’s 2022 report Inequalities Experienced by Black, Asian, Minority Ethnic and Traveller people residing in Belfast,[Footnote 8] language is a particular barrier to accessing health services. Interpretation services are generally good, although a quarter of those needing an interpreter at the GP or hospital were not able to access them. Telephone-based interpreting services have caused considerable concern among migrant users. Access to mental health support is particularly important for refugees, who have been exposed to trauma during transit to Northern Ireland as well as during conflict and war.
More than 90 per cent of participants who took part in the Council’s Inequalities research Belfast have access to outdoor space for exercise and enjoy time outdoors. Walking is the most popular form of exercise, although this is in part a legacy of restricted access to sports or gym facilities. Less than half (46 per cent) use shared leisure facilities (excluding children’s playgrounds), but those that do report good opportunities for meeting people beyond their immediate social network.
Men and women generally
According to the NI Statistics and Research Agency’s (NISRA) Life Expectancy at birth 2019–21 statistics,[Footnote 9] the average life expectancy for the NI population is 78.4 for males and 82.2 for females. Belfast has the lowest life expectancy in NI for both males (75.6 years) and females (80.5 years). The gap between male and female life expectancy is also largest in Belfast – 4.9 years in favour of females compared to 3.8 in favour of females across NI.
Women are, however, more likely to experience long-term health problems. On Census day 2011, almost a quarter of women in Belfast, compared to 1 in 5 men, reported a disability or a long-term health problem that affects their day-to-day activities. [Footnote 10] Similarly, according to the results of the 2021-2022 Health Survey Northern Ireland,[Footnote 11] women are less likely than men to rate their health as good or very good.
| Self-rating of health | Men | Women |
|---|---|---|
| Very good | 37per cent | 36 per cent |
| Good | 38 per cent | 19 per cent |
| Fair | 15 per cent | 7 per cent |
| Bad | 8 per cent | 2 per cent |
| Very bad | 2 per cent | 2 per cent |
According to the Health Survey NI 2020-2021, around a fifth (21 per cent) of respondents had a high GHQ12 score, which could indicate a mental health problem. Men (16 per cent) were less likely than females (25 per cent) to have a high GHQ12 score. [Footnote 12]
According to Department for Communities 2021/2022 statistics for the whole of NI, 57 per cent of men and 37 per cent of women had participated in sport in the past year. [Footnote 13]
Age
While, in general, the population is living longer, this is often with long-term health conditions. In Belfast on Census day 2021, 37.1 per cent of people aged 65 and over reported that they had no limiting health problems or disabilities. This is compared to 73.3 per cent across the general population. [Footnote 14]
| All ages | 0–14 | 15-39 | 40-64 | 45-64 | 65+ | |
|---|---|---|---|---|---|---|
| Day-to-day activities limited a lot | 13.6per cent | 4.3per cent | 5.9per cent | 18.5per cent | 22.5per cent | 34.1per cent |
| Day-to-day activities limited a little | 13.2per cent | 6.5per cent | 8.7per cent | 15.1per cent | 12.0per cent | 28.8per cent |
| Day-to-day activities not limited | 73.3per cent | 89.3per cent | 85.5per cent | 66.4per cent | 65.5per cent | 37.1per cent |
People aged 65 and over are also less likely to report good or very good health (42.9 per cent) than the general population of all ages (75.8 per cent). [Footnote 15]
According to Belfast City Council’s 2021 residents’ survey, young people aged 16 to 24 tended to report higher wellbeing scores. People aged 65 and over reported the lowest wellbeing scores for physical health. Young people aged 16 to 24 also tended to use Belfast City Council leisure centres (28 per cent) and pitches (30 per cent) more frequently than the other age groups and compared to less than 3 per cent of those aged 60 and over.
Residents’ survey participants were also asked, on average, how much time do you usually spend in a week doing at least moderate physical activity? People aged 16 to 59 reportedly spending over 8 hours a week being physically active while people aged 65 and over reported 4.74 hours.
People aged 65 and over also reported the highest levels of loneliness with over a quarter (27 per cent) indicating that they felt lonely always, often or some of the time. No young person reported feeling lonely often or always with most (72 per cent) stating they were hardly ever or never lonely. However, over a quarter (28 per cent) did report feeling lonely occasionally or some of the time.
Disability
According to the 2021 Census, just over 1 in 4 Belfast residents (26.7 per cent) have a long-term health condition or disability that limits their day-to-day activities. This is slightly higher than the NI average of 24.4 per cent. [Footnote 16]
| Geography | Day-to-day activities limited a lot | Day-to-day activities limited a little | Day-to-day activities not limited |
|---|---|---|---|
| Northern Ireland | 11.5per cent | 12.9per cent | 75.7per cent |
| Belfast | 13.6per cent | 13.1per cent | 73.3per cent |
Belfast residents are also more likely to have more than one long-term health condition (18.9 per cent) compared to 16.6 per cent across NI, with 2.6 per cent having 5 or more long-term health conditions. [Footnote 17]
According to Department for Communities 2021/22 statistics for the whole of NI, 29 per cent of disabled people participated in sport in the past year compared to 52 per cent of people without disabilities. [Footnote 18]
Sexual orientation
According to the Rainbow Project’s 2013 report, Through Our Minds: Exploring the Emotional Health and Wellbeing of Lesbian, Gay, Bisexual and Transgender People in Northern Ireland:[Footnote 19]
- LGBTQ+ people score less well on the Warwick-Edinburgh Mental Wellbeing Scale
- 70.9 per cent of research participants had experienced depression
- 35.3 per cent had self-harmed
- 46.9 per cent had experienced suicide ideation and 25.7 per cent had attempted suicide
The report also found that LGBTQ+ people faced barriers to accessing health services including lack of relevance and stigmatisation.
People with dependants
According to the 2021 Census, 12.3 per cent of Belfast residents provide unpaid care. People aged 40 to 64 (20.1 per cent) and 65 and over (12.0 per cent) are most likely to provide unpaid care. [Footnote 20]
According to Department for Communities 2021/22 statistics for the whole of NI, 49 per cent of people with dependants and 43 per cent of people without dependants had participated in sport in the past year. [Footnote 21]
Marital status
Across NI, single people (79 per cent) and people who are married or in a civil partnership (77 per cent) are more likely to rate their health as good or very good compared to separated (53 per cent), divorced (51 per cent) and widowed people (50 per cent). [Footnote 22]
According to DfC 2021/22 statistics for the whole of NI, people who are single, married or cohabiting are most likely to have participated in sport in the past year (48 per cent) compared to 31 per cent who are separated or divorced and 15 per cent of those who are widowed. [Footnote 23]
Community and neighbourhood regeneration
The following section contains evidence in relation to key differential impact on section 75 groups including age, religion/political opinion, ethnic background and sexual orientation. While there is no or limited data in relation to marital status and people without and without dependants, lack of evidence does not mean there is no differential impact.
Religious background/political opinion
According to PSNI statistics, there were 324 incidents and 242 crimes recorded with a sectarian motivation in Belfast in 2021. The PSNI notes that the figure for 2021/22 for the whole of NI shows a fall of 47 per cent when compared with the highest level recorded in 2005/06. [Footnote 24]
Ethnic background
According to PSNI statistics, [Footnote 25] there were 571 incidents and 369 crimes recorded with a racist motivation in Belfast in 2021. The PSNI has also noted a sharp rise in the number of racist incidents and crimes across NI between 2020/21 and 2021/22. The number of racist crimes recorded in 2021/2022 is the highest since the start of the data series. [Footnote 26]
Despite having established minority communities there are no distinct ethnic residential areas in Belfast, although south Belfast has historically been considered the most diverse area. Minority ethnic and migrant residents rely on networks of informal knowledge about safe areas to live. There is some mobility between nationalist and loyalist areas, but there continues to be a substantial level of racist and xenophobic hate crime in the city, and this is used strategically in some areas to deter migrants and minority ethnic residents from choosing to live there. Four in five people feel happy with the neighbourhood they live in, because of relationships with their neighbours and access to good local facilities. [Footnote 27]
People from minority ethnic community backgrounds commonly turn to minority ethnic-led or migrant support organisations for information and advice. There is little opportunity or interest in joining other community groups, as local residents’ groups are perceived as uninterested in migrant or minority ethnic members joining them, and opportunities for interaction are seen as limited. [Footnote 28]
Men and women generally
According to Belfast City Council’s 2021 residents’ survey, women are less likely than men to:
- feel safe in their local area at night (84 per cent compared to 88)
- feel safe in the city centre during the day (80 per cent compared to 87)
- feel safe in the city centre at night (50 per cent compared to 64)
Across NI, the PSNI has recorded an increase in transphobic incidents and crimes since 2017/2018 with a substantial increase seen in both incidents and crimes in 2019/2020. In 2021/2022, the number of transphobic motivated crimes recorded increased to the highest level in the data series. [Footnote 29]
Disability
According to PSNI statistics, in 2022/2023 disability-motivated hate incidents increased from 123 to 139, and disability-motivated hate crimes rose from 93 to 102. These are the highest figures for both disability incidents and crimes since the recording of disability motivation began in 2005/2006. [Footnote 30]
Age
While at least half of all respondents to Belfast City Council’s 2021 residents’ survey have lived in their local area for more than 10 years, a significantly higher portion of people aged 65 and over – almost 9 in 10 – have lived in their area for more than 10 years.
The survey also found that 85 per cent of residents are satisfied and 5 per cent dissatisfied with Belfast as a place to live. Young people aged 16 to 24 were slightly more likely to say they were neither satisfied or dissatisfied with living in Belfast compared to the other age groups.
Residents generally report high levels of feeling safe during the day in their local area. However, perceptions of safety decrease at night, particularly among people aged 65 and over.
People aged 65 and over were, however, slightly more likely to agree that Belfast is ‘welcoming, safe, fair and inclusive for all’, while young people aged 16 to 24 were slightly more likely to disagree.
Older people were also more likely to disagree that their local area had good quality parks and green spaces (13 per cent compared to 7 per cent of young people aged 16 to 24) and were safe parks and green spaces (12 per cent of people aged 65 and over compared to 5 per cent of young people aged 16 to 24).
60 per cent of young people aged 16 to 24 agreed that ‘local agencies and service providers in Belfast work together for the benefit of local people’ compared to 70 per cent of respondents of all ages. However, older people aged 65 and over were more likely to disagree that ‘local agencies and service providers in Belfast work together for the benefit of local people’ (around 1 in 10 compared to 8 per cent across all ages).
Young people aged 16 to 24 tended to hold more positive perceptions in terms of their local area having a strong sense of community (89 per cent) and people working together to improve things (85 per cent) compared to the other age groups (82 and 80 per cent respectively).
Sexual orientation
According to PSNI statistics, [Footnote 31] there were 159 incidents and 104 crimes recorded with a homophobic motivation in Belfast in 2021. The PSNI notes the sharpest increase in the number of homophobic motivated incidents and crimes has been recorded in the latest two financial years (2020/21 and 2021/22) with both incidents and crimes rising to their highest levels recorded since the data series began in 2004/5. [Footnote 32]
One of the key issues for LGBTQ+ people is the promotion of community safety across the city to reduce both homophobic hate crime incidents and fear of crime. Research by the Rainbow Project in 2009 found that:
- 21 per cent of LGBTQ+ males and 18 per cent of LGBTQ+ females had been victim of one or more homophobic hate crimes or incidents in the previous three years
- 30 per cent of those incidents resulted in physical injury
- 13 per cent of LGBTQ+ people felt that harassment or attacks on people because of their sexual orientation was a big issue in their neighbourhood
- 39 per cent were worried about being the victim of crime
- 18 per cent had moved to an area they feel safer to avoid being a victim of crime [Footnote 33]
Theme 2: Our economy
Educational inequalities
The following section contains evidence in relation to key differential impacts on section 75 groups including gender, religion/political opinion, ethnic background, age, disability and sexual orientation. While there is no or limited data in relation to marital status and people without and without dependants, lack of evidence does not mean there is no differential impact.
Religion and gender
In its 2017 report on Key Inequalities in Education, [Footnote 34] ECNI highlighted the following:
- Males continue to have lower levels of attainment than females, beginning in primary school and continuing throughout schooling to GCSE and A Level. Fewer male school leavers enter higher education than do females.
- Protestants continue to have lower levels of attainment than Catholics at GCSE, GCSEs including English and Maths, and A Level. Fewer Protestant school leavers enter higher education than do Catholics.
- There is persistent underachievement and lack of progression to further and higher education of school leavers entitled to free school meals, particularly Protestants, notably Protestants males.
These tables provide a breakdown of the qualifications of school leavers in 2020/2021. [Footnote 35]
| Protestant | Boys per cent | Girls per cent | Total per cent |
|---|---|---|---|
| 3+ A-levels A*-C |
38.3 |
59.9 |
48.9 |
| At least 5 GCSEs A*-C incl. English and maths |
70.9 |
81.3 |
76.0 |
| No Formal Qualifications |
0.8 |
0.4 |
0.6 |
| Catholic | Boys per cent | Girls per cent | Total per cent |
|---|---|---|---|
| 3+ A-levels A*-C |
47.5 |
67.0 |
57.0 |
| At least 5 GCSEs A*-C incl. English and maths |
75.4 |
83.8 |
79.5 |
| No Formal Qualifications |
0.8 |
0.5 |
0.6 |
| Other including: Other Christian, No religion and Non-Christian | Boys per cent | Girls per cent | Total per cent |
|---|---|---|---|
| 3+ A-levels A*-C |
41.0 |
55.4 |
48.0 |
| At least 5 GCSEs A*-C incl. English and maths |
69.8 |
80.3 |
74.9 |
| No Formal Qualifications |
0.7 |
1.0 |
0.9 |
Regardless of religion, girls are more likely to leave school with three A-levels (A to C) and five GCSEs (including Maths and English) than boys.
School leavers from a Catholic community background are more likely to attain three A-levels (A to C) and five GCSEs (including Maths and English) with Catholic girls most likely to attain qualifications of this standard.
Protestant boys are least likely to attain three A-levels (A to C) while boys from neither a Protestant nor Catholic community background are least likely to attain five GCSEs (including Maths and English). [Footnote 36]
Gender
In its 2017 report on Key Inequalities in Education, [Footnote 37] the ECNI found that lower attainment impacts on male entry into higher education with women more likely to go on to higher education. However, women are less likely to enter STEM subject areas such as when examining subject choice in higher education, males are much more likely than females to enter the STEM (such as Science, Technology, Engineering and Maths) which reflect growth industries in NI and which may offer more secure, higher paying jobs.
The Northern Ireland Skills Barometer 2021 [Footnote 38] further found that
‘The undersupply in many of the narrow STEM subjects has been a continual theme throughout NI Skills Barometer publications. A key challenge in meeting the demand is to address the lack of females studying and qualifying within narrow STEM related subjects. For example, almost two-fifths (36 per cent) of male HE qualifiers are within narrow STEM subjects, compared to just 16 per cent of females. If the NI education system is to meet the required demand for narrow STEM over the next decade it must significantly increase the number of qualifiers within these subject areas, and in particular encourage young women to study within these areas.”
Ethnic background
In its 2017 report on Key Inequalities in Education, [Footnote 39] ECNI highlighted:
- Children from the Traveller community and Roma children have some of the lowest levels of attainment of all equality groups.
- Bullying, including prejudice-based bullying, in schools is a persistent problem. A number of equality groups are more vulnerable to prejudice-based bullying, or more likely to be bullied in schools including minority ethnic students, with two fifths of minority ethnic students reported as having been the victims of racist bullying and harassment
According to the Northern Ireland Assembly Research and Information Service, since 2016 increasing numbers of post-primary aged asylum seeker and refugee pupils have registered in a relatively small number of schools in the north, west and south of Belfast. [Footnote 40]
According to Department for Education statistics for 2020/2021, [Footnote 41] attainment of A-levels at grades A to C are relatively consistent regardless of ethnic background. However, there is a more pronounced difference at GCSE with 72.8 per cent of school leavers from a minority ethnic background attaining 5 GCSEs (including English and Maths) compared to 77.8 per cent of white school leavers. School leavers from a minority ethnic background are also more likely to leave school without any formal qualifications (2.4 per cent compared to 0.6 per cent of white school leavers). [Footnote 42]
| Qualifications | White | Minority ethnic groups |
|---|---|---|
| 3+ A-levels A*-C |
52.9 per cent |
52.7 per cent |
| At least 5 GCSEs A*-C incl. English and maths |
77.8 per cent |
72.8 per cent |
| No Formal Qualifications |
0.6 per cent |
2.4 per cent |
However, Traveller children may be an exception with ECNI estimating between just over half and 8 out of 10 Traveller children leave school with no GCSEs. [Footnote 43]
Belfast City Council’s Inequalities Experienced by Black, Asian, Minority Ethnic and Traveller people residing in Belfast found that more than half of parents from minority ethnic backgrounds have concerns about their child’s school, particularly around discrimination and exclusion. Two-fifths of parents reported that their children experienced racist bullying in schools. In some schools, and for some groups, there is evidence of systematic discrimination, including against Roma, Muslims and people of African descent. Language is a particular barrier to strong communication between parents and schools. [Footnote 44]
Age
76.2 per cent of adults in Belfast aged 16 to 64 had a level 2 or above qualification in 2021. This is the highest level in the past six years. The rate across NI as a whole is 78.5 per cent.
Between 2016 and 2021, there has been a general increase in the proportion of working age adults with qualifications, with 76.2 per cent of Belfast residents aged 16 to 64 holding a level 2 or above qualification and 60.2 per cent with a level 3 or above qualification. A higher proportion of females and those aged 25 to 34 were qualified to level 2 and above. A higher proportion of males and 16-to-24-year-olds held a qualification between level 3 and 5. [Footnote 45]
Those aged 50 to 64 were the least likely to participate in education or training – 11.5 per cent compared to 21.8 per cent of 25-to-34-year-olds and 20.3 per cent of 35-to-49-year-olds and for those who did engage, the highest participation rate was for those qualified to Level 6 and above (equivalent to first degree or higher). [Footnote 46]
According to the Northern Ireland Skills Barometer 2021, there is increasing demand in both IT and non-IT sectors with “most roles, and wider society, now requiring digital competency.”[Footnote 47] The NI Assembly’s research in to the digital divide in NI found a strong relationship between age and digital exclusion particularly among those aged 55 and over and 65 and over, [Footnote 48] while the ECNI’s response to the consultation on the draft Skills Strategy for Northern Ireland: Skills for a 10x Economy [Footnote 49] also notes that digital technology in itself may be a barrier for lifelong learning among older people.
ECNI’s response to the consultation on the draft Skills Strategy for Northern Ireland also notes that there could be a differential impact for children and young people as
‘COVID-19 saw a shift to digital based teaching curriculum support materials and we have noted the impact they may have on education. For example, differential access to home computing and/or internet access, which even if available in the home may have needed to be shared with parents/carers or siblings (due to their work or learning needs), may have limited access to teaching/curriculum support materials, and/or opportunities to engage in virtual learning or discussions.’
Disability
In its 2017 report on Key Inequalities in Education, [Footnote 50] ECNI highlighted:
- Students with SEN or a disability have lower attainment levels than students without any SEN or disability and are less likely to go on to higher education.
- Bullying, including prejudice-based bullying, in schools is a persistent problem. A number of equality groups are more vulnerable to prejudice-based bullying, or more likely to be bullied, in schools. Research identified:
- over two fifths of disabled pupils are being bullied;
- and students with SEN also experience bullying.
According to the 2021 Census, 1.2 per cent of Belfast residents aged 0 to 15 have an intellectual or learning disability. [Footnote 51]
According to the Youth Wellbeing Prevalence Survey 2020, 7.7 per cent of children and young people had scores on a screening tool for autism spectrum disorder which suggested that further assessment was indicated. Prevalence estimates were significantly higher for males than females (9.2 per cent compared to 6.1 per cent). [Footnote 52]
77.7 per cent of school leavers with special educational needs attain 5 GCSEs (including Maths and English), and 52.9 per cent attain 3 A-levels (grades A to C). [Footnote 53]
| Qualification |
Total per cent |
|---|---|
| 3+ A-levels A*-C |
52.9 |
| At least 5 GCSEs A*-C incl. English and maths |
77.7 |
| No Formal Qualifications |
0.6 |
However, the Labour Force Survey for October to December 2022 found that disabled people are less likely to be qualified above GCSE and more likely to have no qualifications than the general population. [Footnote 54]
| Qualification | With a disability (percentage) |
Without a disability (percentage) |
|---|---|---|
| Degree/Equivalent |
16.6 |
33.0 |
| Other Higher |
5.1 |
7.2 |
| A Level/equivalent |
21.1 |
25.0 |
| GCSE equivalent |
23.7 |
20.7 |
| Other |
5.5 |
4.9 |
| No Qualification |
27.9 |
9.1 |
According to the Northern Ireland Skills Barometer 2021, there is increasing demand in both IT and non-IT sectors with “most roles, and wider society, now requiring digital competency.”[Footnote 55] ECNI’s response to the consultation on the draft Skills Strategy for Northern Ireland: Skills for a 10x Economy [Footnote 56] notes that disabled adults are significantly less likely to use the internet than adults without disabilities, which is likely to exacerbate educational and employment inequalities.
Sexual orientation
In its 2017 report on Key Inequalities in Education, [Footnote 57] ECNI found that a number of equality groups are more vulnerable to prejudice-based bullying, or more likely to be bullied, in schools with over six out of ten trans pupils and students with same sex attraction having been called hurtful names related to their sexual or gender identity.
Jobs and skills
Religion
According to ECNI, in the private sector:
‘In 2021, for the first time since monitoring began, the share of the total monitored workforce from members of the Protestant community was 50.0 per cent and members of the Roman Catholic community 50.0 per cent. This marks an end to the long-established trend of members of the Protestant community accounting for a greater share of the total monitored workforce’.
Similarly, the Protestant community share of the public sector was 49.7 per cent, gradually decreasing from 59.8 per cent in 2001. [Footnote 58]
The 2017 Labour Force Survey Religion Report found that 42 per cent of the working-age population of Belfast was Protestant and 58 per cent, Catholic. 69 per cent of working-age Protestants and 66 per cent of Catholics were economically active. While there were relatively small decreases in working-age Protestant economic activity since 1995, working-age Catholic economic activity increased from 53 per cent.
Among Protestants of working age in Belfast, the employment rate was 67 per cent compared to 62 per cent among Catholics. This is a slight increase for Protestants since 1995, and a considerable increase from 44 per cent for Catholics in 1995.
The 2017 survey also found that 37 per cent of working-age economically active Protestants and 39 per cent of working-age economically active Catholics had a higher-level qualification. This was an increase from 2015 for both groups when the respective figures were 32 per cent and 37 per cent. [Footnote 59]
Ethnic background
The 2011 Census showed that 59 per cent of people aged 16 to 74 from an ethnic minority background were employed, which was slightly higher than the whole population (57.6 per cent) at that time. 69 per cent of people from the Traveller community were economically inactive. [Footnote 60]
In its 2018 report on Key Inequalities in Employment, [Footnote 61] ECNI identified persistent inequalities in employment spanning 2007 and 2016:
- Irish Travellers are less likely to be in employment than all other ethnic groups
- Migrant workers, particularly those from Eastern European countries, are subject to industrial and occupational segregation
- Migrant workers and refugees face multiple barriers to employment such as lack of recognition for qualifications, language proficiency and uncertainty among employers about migrant workers’ ‘right to work’
- Migrant workers are vulnerable to exploitation
Belfast City Council’s Inequalities Experienced by Black, Asian, Minority Ethnic and Traveller people residing in Belfast found that employment experiences in Belfast vary significantly by ethnic and national group, but these are more related to the educational levels common to the group and the transferability of qualifications. Those in work largely report good relations with their work colleagues. Progress is an issue, however. Professionals generally reported good access to employment but poor promotion prospects in work. People in middle-income jobs had often started in lower-income jobs on arrival in Belfast, but the mobility of low-income workers is not predictable. Many participants describe having taken lower-income jobs on arrival with the expectation of progressing, yet remain in jobs far below their qualifications, even after becoming fluent in English. [Footnote 62]
In 2015, the Northern Ireland Council for Ethnic Minorities identified a number of barriers to employment for people from ethnic minority groups, including:
- Recognition of qualifications
- Work experience and voluntary work overseas being discounted
- The importance placed on references from NI employers
- Language proficiency
- The reliance on job application forms (something that many people are unused to)
- Employment agencies have no capacity to translate documentation needed to support applications
Belfast City Council’s Inequalities Experienced by Black, Asian, Minority Ethnic and Traveller people residing in Belfast also found that:
- unemployed people from minority ethnic backgrounds may not be aware of work-related training and support available
- women who wished to enter the labour market were restricted from doing so by the cost of childcare. [Footnote 63]
Gender
According to ECNI’s Fair Employment Monitoring Report for 2021, the female share of private sector was 45.6 per cent, a decrease of 0.7 percentage points from 2020. The female share of private sector employment has fluctuated above 45.0 per cent since a peak of 46.3 per cent in 2010.
In the public sector in 2021, the female share was 65.8 per cent, relatively unchanged from 2020 although there has been an increase overall of 6.7 percentage points from 59.1 per cent in 2001. [Footnote 64]
According for the Labour Force Survey, in Belfast between October and December 2022, 69.9 per cent of females and 63.9 per cent of men were in employment compared to 68.1 per cent of females and 72.4 per cent of males across the whole of NI.
Over the same period in Belfast, 28.1 per cent of females were economically inactive and 31.3 per cent of males compared to the NI average of 29.7 and 24.2 per cent. [Footnote 65]
Based on the Annual Survey of Hours and Earnings, the gender pay gap for all employees in NI was 8.4 per cent in favour of males in 2022 (that is, for every £1 earned by men, women earned 92p). According to NISRA, this is due to the higher proportion of female part-time employees than male part-time employees and the higher proportion of part-time jobs that are low paid. [Footnote 66]
Other frequently cited explanations for the gender differential in employment include:
- disproportionate responsibility for childcare and unpaid caring
- sectors predominated by female employees, such as retail and care, tend to be low paid
- part-time jobs are more likely to be on a casual or atypical contract
- perception that when female-generated income is being spent on childcare, paid work may not be seen as worthwhile
In its 2018 report on Key Inequalities in Employment, [Footnote 67] ECNI identified persistent inequalities in employment spanning 2007 and 2016:
- Women experience a lower employment rate and a higher economic inactivity rate when they have dependants
- Women, lone parents with dependants and carers providing less than 49 hours of care are more likely to be in part-time work
- Women experience industrial segregation (under-represented in industries associated with Science, Technology, Engineering and Mathematics)
- Women and lone parents experience occupational segregation (underrepresented in higher-status occupations and overrepresented in lower status occupations)
- Prejudicial attitudes are experienced by Trans people
In its 2017 report on Key Inequalities in Education, [Footnote 68] found that lower attainment among males at GCSE and A-level means that women are more likely to go on to higher education. However, women are less likely to enter STEM subject areas such as when examining subject choice in higher education, males are much more likely than females to enter the STEM (such as Science, Technology, Engineering and Maths) which reflect growth industries in NI and which may offer more secure, higher paying jobs.
There is currently limited data in relation to employment among the transgender community. However, research points to prejudice and hostility in the workplace, and trans people feel less likely to be open about their gender identity, which may affect how people participate in and sustain employment.
Age
ECNI’s analysis of historical Labour Force Survey in its Key Inequalities in Employment report found that at nearly all time points, young people aged 18 to 24 had the highest rates of unemployment. Young men in particular experience higher unemployment. [Footnote 69]
Older people aged 50 to 64 also experience age-related inequalities in relation to participation in employment. This age group is less likely to be in employment and more likely to be economically inactive than those aged 25 to 49. Economic inactivity may be linked to the rising retirement age, long-term sickness or the provision of unpaid care. [Footnote 70]
The following table provides a breakdown of economic inactivity across NI for October to December 2022 by age and gender. [Footnote 71]
| Age group | Male (percentage) |
Female (percentage) |
All persons (percentage) |
|---|---|---|---|
| 16 to 24 | 15.9 | 13.3 | 14.4 |
| 25 to 34 | 4.4 | 7.8 | 6.4 |
| 35 to 44 | 5.3 | 7.2 | 6.4 |
| 45 to 54 | 8.9 | 9.2 | 9.1 |
| 55 to 64 | 15.2 | 16.5 | 15.9 |
| 65+ | 50.3 | 45.9 | 47.8 |
According to NISRA, young people earn less in general, but they have experienced the greatest increase in wages over the past 10 years. The 60-plus age group saw a substantial drop in real earnings over the same period. [Footnote 72]
The gender pay gap is most pronounced for those aged 40 and over is more pronounced with the largest pay gap in favour of males between 50 and 59 years old (a difference of £2.95). Thirty to 39 is the only age group where females earned slightly more than males (12p). [Footnote 73]
According to the Northern Ireland Skills Barometer 2021, there is increasing demand in both IT and non-IT sectors with “most roles, and wider society, now requiring digital competency.”[Footnote 74] The NI Assembly’s research in to the digital divide in NI found a strong relationship between age and digital exclusion particularly among those aged 55 and over and 65 and over. [Footnote 75]
Disability
According to the 2021 Census, 11.2 per cent of Belfast residents are economically inactive because they are long-term sick or disabled. The NI average is 8.0 per cent. [Footnote 76]
DfC’s Disability within the Northern Ireland Labour Market 2022 report found key inequalities in relation to disability and employment including:
- the economic inactivity rate for people with disabilities in Northern Ireland is 17.2 percentage points above that of people with disabilities in the UK. The corresponding gap for non-disabled people is 1.9 percentage points.
- the employment rate for people with disabilities (38.1 per cent) is 14 percentage points below the rate for non-disabled people (80.3 per cent).
- the disability employment rate:
- is smallest for the 16 to 24 age group, driven by the lower employment rate for non-disabled 16- to 24-year-olds
- narrows as qualification levels increases
- Employment rates for people with disabilities varied by impairment with those with depression, anxiety, severe or specific learning problems or nervous disorders experiencing the lowest employment rate at 31.2 per cent
- People with disabilities are more likely to be employed in elementary occupations, caring, leisure and other service occupations or sales and customer services occupations
- the average weekly earnings of people with disabilities were £103 lower than the earnings of non-disabled people
- disabled people reported lower satisfaction scores across a range of work quality metrics including career progression, involvement in decision making, job satisfaction and meaningful work. [Footnote 77]
In its 2018 report on Key Inequalities in Employment,[Footnote 78] ECNI identified that there was a persistent employment gap between people with and without disabilities.
According to the Northern Ireland Skills Barometer 2021, there is increasing demand in both IT and non-IT sectors with “most roles, and wider society, now requiring digital competency.”[Footnote 79] ECNI’s response to the consultation on the draft Skills Strategy for Northern Ireland: Skills for a 10x Economy[Footnote 80] notes that disabled adults are significantly less likely to use the internet than adults without disabilities, which is likely to exacerbate employment inequalities.
Sexual orientation
There is little statistical information available on the economic opportunities of LGBTQ+ individuals in Northern Ireland. However, ECNI’s Key Inequalities in Employment,[Footnote 81] identifies that LGBTQ+ employees are subject to prejudicial attitudes in the workplace and that these prejudicial attitudes may impact their ability to participate in employment, sustain employment and progress in employment. Homophobic harassment at work features significantly. [Footnote 82]
Rainbow’s 2011 report, Through our Eyes: Experiences of Lesbian, Gay and Bisexual People in the Workplace, found that:
- More than 1 in 4 (26.9 per cent) respondents from the private sector and almost 1 in 4 (24.5 per cent) respondents from the public sector conceal their sexual orientation in the workplace
- 42.5 per cent of respondents from the private sector, 40 per cent from the public sector and 31 per cent from the community and voluntary sector have heard negative comments about LGB people from a colleague or colleagues in the workplace
- Almost 1 in 3 (31.7 per cent) LGB people in the private sector and more than 1 in 4 (26.3 per cent) LGB people working in the public sector believe that their sexual orientation will have a negative impact on their chances of progressing in work
Dependants and marital status
According to the 2021 Census, 5.2 per cent of Belfast residents are economically inactive because they are looking after the home or family. The NI average is 3.8 per cent. [Footnote 83]
In its 2018 report on Key Inequalities in Employment,[Footnote 84] ECNI identified persistent inequalities in employment spanning 2007 and 2016:
- Women experience a lower employment rate and a higher economic inactivity rate when they have dependants
- Lone parents with dependants and carers experience barriers to employment
- Women, lone parents with dependants and carers providing less than 49 hours of care are more likely to be in part-time work
- Women and lone parents experience occupational segregation (underrepresented in higher-status occupations and overrepresented in lower status occupations)
According to Raeside et al. [Footnote 85]:
- Lone parents with dependent children have much higher rates of economic inactivity than those who have no dependents and those who are married or cohabiting with dependent children
- Lone parents with dependent children were more likely to work part-time – over half (51.1 per cent) of lone parents with dependent children were in part-time employment compared to around a quarter (24.1 per cent) of married or cohabiting parents with dependent children and 15.2 per cent of those with no dependent children.
- While part-time working is one of a number of means by which women, lone parents and carers balance employment with caring responsibilities, it can negatively influence progression in employment and there is also at risk of low pay and precarious employment, as many part-time jobs are often associated with the minimum wage and atypical contracts.
Sustainable and inclusive economic growth
For further data relating to inclusive growth, see sections relating to Jobs and skills and Inclusive growth and anti-poverty in particular.
Discrete actions under the Sustainable and inclusive economic growth action plan relate to enterprise.
According to Labour Force Survey statistics for NI for October to December 2022, 16.9 per cent of men are self-employed compared to 6.5 per cent of women. [Footnote 86]
Nearly two-fifths (38.8 per cent) of the self-employed workforce are aged 45 to 59. The smallest proportion comprises those aged 16 to 29 (12.7 per cent). [Footnote 87]
Theme 3: Our place
Housing-led regeneration
Religion
According to Northern Ireland Housing Statistics, in 2021/2022, there were 180 presenting as homeless due to intimidation including paramilitarism and sectarianism. [Footnote 88]
ECNI’s Statement on Key Inequalities in Housing and Communities in Northern Ireland (2016)[Footnote 89] found that Catholic household reference person applicants for social housing continue to experience the longest waiting times.
Ethnic background
According to Belfast City Council’s Inequalities Experienced by Black, Asian, Minority Ethnic and Traveller people residing in Belfast, housing quality and overcrowding are the most significant issues facing migrant and minority ethnic residents of Belfast. House ownership is seen as desirable but difficult due to low-income, insecure occupations, cost of living and availability of credit networks. Overcrowding is the most significant issue in social housing. Discrimination in the private rental market is also driving people into precarious living situations, with short-term and even exploitative illegal rental agreements. It also impacts on responses to tenant complaints about repairs or health risks. There appears to be a growing risk of migrant and refugee destitution in Belfast for those in precarious housing situations. [Footnote 90]
According to Northern Ireland Housing Statistics, in 2021/2022, there were 180 people presenting as homeless due to intimidation including racial abuse. [Footnote 91]
ECNI’s Statement on Key Inequalities in Housing and Communities in Northern Ireland (2016)[Footnote 92] found that:
- Access to appropriate accommodation for Irish Travellers is limited.
- Homes of minority ethnic people and migrant groups may be vulnerable to racial attacks.
- Migrant workers are vulnerable to becoming subject to tied accommodation
with poor conditions and overcrowding. - Minority ethnic people, especially Roma, Irish Travellers, Asian, Black and Other ethnic groups, experience overcrowding more often than the general population and white people.
Gender
ECNI’s Statement on Key Inequalities in Housing and Communities in Northern Ireland (2016)[Footnote 93] found that single male reference person households are more likely than single female reference person households to present as homeless.
According to Northern Ireland Housing Statistics, in 2021/2022, those presenting as homeless included 5,375 men and 2,806 women. [Footnote 94]
Age
According to Northern Ireland Housing Statistics 2021 to 2022, younger people are also less likely to be satisfied with their homes (88 per cent of 16- to 24-year-old and 86 per cent of 25- to 34-year-olds compared to 95 per cent of those aged 65 and over). [Footnote 95]
ECNI’s Statement on Key Inequalities in Housing and Communities in Northern Ireland (2016)[Footnote 96] found that:
- Households with a younger household reference person (those aged under 35 years old) who are in receipt of the Local Housing Allowance may find it more difficult to obtain private rented homes than households with a reference person aged 35 years old and older.
- Households with an older reference person, those aged 60 years old or older, are more likely to live in non-decent homes and homes that require adaptations than households with a reference person aged under 60 years old.
Disability
According to Northern Ireland Housing Statistics 2021 to 2022,[Footnote 97] disabled people are less likely to be satisfied with their homes (86 per cent) than people without a disability.
ECNI’s Statement on Key Inequalities in Housing and Communities in Northern Ireland (2016)[Footnote 98] found that:
- Those with a learning disability are not always afforded an opportunity to live independently.
- Many people with disabilities live in homes that are not adequate to meet their disability related needs.
Sexual orientation
According to Northern Ireland Housing Statistics, in 2021/2022, 180 people presented as homeless due to intimidation including due to sexual orientation. [Footnote 99]
ECNI’s Statement on Key Inequalities in Housing and Communities in Northern Ireland (2016)[Footnote 100] found that LGBTQ+ people can feel harassed and unsafe in their own homes and neighbourhoods and are at high risk of being the victim of hate crimes, including crimes against the person and property related crimes.
People with and without dependants
ECNI’s Statement on Key Inequalities in Housing and Communities in Northern Ireland (2016)[Footnote 101] found that household reference persons without dependent children living in the private rented sector are more likely to live in non-decent homes.
According to Northern Ireland Housing Statistics, in 2021/2022, those presenting as homeless included 4,733 families. [Footnote 102]
Marital status
According to Northern Ireland Housing Statistics, in 2021/2022, there were 1,611 people presenting as homeless due to martial/relationship breakdown and 1,110 due to domestic abuse. Those presenting as homeless included 5,375 men, 2,806 women, 4,733 families and 2,090 pensioner households. [Footnote 103]
Future city centre and wider city regeneration and investment
This section considers data in relation to age and Future city centre regeneration and investment. While key inequalities have not been identified in relation to other section 75 dimensions, lack of evidence does not mean there is no differential impact. Data presented elsewhere in this report, particularly in relation to the Community and neighbourhood regeneration action plan, may also be relevant.
According to Belfast City Council’s 2021 residents’ survey, 80 per cent of residents agree that the city centre is a vibrant and attractive place with lots going on. Young people aged 16 to 24 were more likely to agree (87 per cent) compared to those aged 65 and over (81 per cent). However, 1 in 10 young people disagreed (11 per cent) compared to around 8 per cent of other age groups.
Young people visited the city centre more regularly than the other age groups:
- 76 per cent of young people aged 16 to 24 visited the city centre at least weekly during the day and 41 per cent at least weekly in the evening
- 58 per cent of people aged 25 to 59 visited the city centre at least weekly during the day and 41 per cent at least weekly in the evening
- 39 per cent of people aged 65 and over visited the city centre at least weekly during the day, with only 31 per cent in the evening
Residents aged 65 and over feel less safe in the city centre compared to the other age groups. Women also report a lower sense of safety compared to men, especially at night time.
Residents generally report high levels of feeling safe during the day in the city centre. However, perceptions of safety fall at night time, particularly among people aged 65 and over, and people aged 65 and over generally tend to feel less safe in comparison to the other age categories.
Connectivity, active and sustainable travel
The following section contains evidence in relation to key differential impact on section 75 groups including ethnic group, gender, age and disability. While key inequalities have not been identified in relation to other section 75 dimensions, lack of evidence does not mean there is no differential impact. Evidence presented elsewhere in the report, in particular in relation to Climate, resilience and sustainability may also be relevant.
Ethnic group
There is limited research into barriers faced by people from minority ethnic backgrounds in relation to Connectivity, active and sustainable travel, although it is likely that lack of access perpetuates social, health and employment inequalities. [Footnote 104]
Gender
According to DfI’s Walking, Cycling and Public Transport in Northern Ireland 2021/2022 statistics:[Footnote 105]
- 97 per cent of men felt very or fairly safe using public transport compared to 93 per cent of women.
- 19 per cent of Belfast residents are likely to cycle a journey up to three miles. This is similar to the NI average (20 per cent).
- Men are most likely to consider cycling up to three miles (29 per cent compared to 12 per cent of women).
- 72 per cent of Belfast residents are satisfied with the current situation for walking in their local area at present compared to the NI average of 67 per cent. Men were more likely to be satisfied (70 per cent compared to 65 per cent of women).
According to DfI’s Attitudes towards Electric Vehicles in Northern Ireland 2021/22 statistics,[Footnote 106] 71 per cent of Belfast residents own a car. 72 per cent of men own or have access to a car or van that they can drive, compared to 66 per cent of women. Men (40 per cent) are most likely to consider buying an electric car as their next car. [Footnote 107]
Age
According to Belfast City Council’s 2021 residents’ survey:
- young people aged 16 to 24 are more likely to agree that ‘Belfast is easy to get about’ than the other age groups (90.5 per cent compared to 86 per cent for people aged 65 and over with the Belfast average at 85 per cent)
- young people are more likely to agree that ‘Belfast has good infrastructure (88 per cent) compared to people aged 65 and over (83 per cent)
- car, van or motorcycle was the preferred method of transport for travelling to work or study for people aged 25 and over (72 per cent for ages 25 to 59 and 79 per cent for 60 and over)
- young people aged 16 to 24 favoured public transport (55 per cent).
- use of cycling as the main method of transport was relatively low for travel to work, study or visiting the city centre: around 4 per cent of young people and 2 per cent or for those aged 25 to 59.
- less than 0.5 per cent of people aged 65 and over said that cycling was the main method of travel for any reason.
According to DfI’s Walking, Cycling and Public Transport in Northern Ireland 2021/2022 statistics:[Footnote 108]
- Young people aged 16 to 24 are most likely to never use public transport (18 per cent).
- 19 per cent of Belfast residents are likely to cycle a journey up to three miles.
- People aged 16 to 24 are most likely to consider cycling up to three miles (29 per cent), and people aged 65 and over are least likely (8 per cent).
- 67 per cent of Belfast residents are likely to walk a journey up to three miles compared to the NI average of 63 per cent.
- People aged 24 to 34 are most likely to consider walking two miles (72 per cent),
- People aged 65 and over are least likely to consider walking two miles (47 per cent).
- 72 per cent of Belfast residents are satisfied with the current situation for walking in their local area at present compared to the NI average of 67 per cent.
- 77 per cent of young people aged 16 to 24 were satisfied compared to 64 per cent of those aged 65 and over.
According to DfI’s Attitudes towards Electric Vehicles in Northern Ireland 2021/2022 statistics,[Footnote 109] 71 per cent of Belfast residents own a car. People aged 35 to 64 (75 per cent) are most likely to own a car.
Disability
According to DfI’s Walking, Cycling and Public Transport in Northern Ireland 2021/2022 statistics:[Footnote 110]
- 37 per cent of disabled people never use public transport compared to 32 per cent of people without a disability
- 77 per cent of disabled people have “no interest” in cycling compared to 62 per cent of people without a disability
- 67 per cent of Belfast residents are likely to walk a journey up to three miles compared to the NI average of 63 per cent. Across NI, the figure is 48 per cent for disabled people and 70 per cent for people without a disability.
- 72 per cent of Belfast residents are satisfied with the current situation for walking in their local area at present. Across NI, the rate is 64 per cent for disabled people and 69 per cent for people without a disability
According to DfI’s Attitudes towards Electric Vehicles in Northern Ireland 2021/2022 statistics,[Footnote 111] 60 per cent of disabled people own or have access to a car or van that they can drive compared to 72 per cent of people without a disability. 34 per cent of disabled people are likely to consider buying an electric car as their next car compared to 39 per cent without disabilities. [Footnote 112]
Theme 4: Our planet
Creating a sustainable, nature – positive city
The following section considers differential impact relating to theme 4 - Our planet (and its three priority areas of innovating to net zero, creating a sustainable circular economy and re-naturing the city and improving the food system) according to age. While key inequalities have not been identified in relation to other section 75 dimensions, lack of evidence does not mean there is no differential impact. Other sections, in particular evidence relating to the Connectivity, active and sustainable travel action plan, may also be relevant.
According to Belfast City Council’s 2021 residents’ survey, people aged 65 and over were more likely to agree that ‘Belfast is an environmentally friendly city’ (77 per cent) compared to young people aged 16 to 24 (70 per cent) and those aged 25 to 59 (71 per cent).
Climate change was more important to those aged under 60 years of age, with 49 per cent stating that it is very important, compared to 30 per cent of those aged 60 and over. A fifth of people aged 65 and over (21 per cent) said that it is not important and/or they didn’t believe in climate change compared to less than 10 per cent for those aged under 60. No one aged 16 to 24 reported that they do not believe in climate change.
When asked what actions they had taken to help prevent climate change, 30 per cent of people aged 65 and over had not taken any of the actions listed compared to 18 per cent of young people aged 16 to 24 and 15 per cent of those aged 25 to 59.
Recycling more was the most frequent action across all age bands followed by reducing plastic or other waste. Those under 60 were more likely to have taken other actions such as changing eating habits or attending demonstrations than those over 60. A third of young people aged 16 to 24 (32 per cent) and almost a fifth (18 per cent) of those aged 25 to 59 had walked, cycled or used public transport instead of taking the car compared to 8 per cent of those aged 60 and over.
One in 10 people aged 65 and over (11 per cent) had discussed climate change with friends and family, slightly lower than those aged 16 to 24 (14 per cent) and significantly lower than those aged 25 to 59 (27 per cent).
In the residents’ survey, people aged 65 and over were also more likely to disagree that their local area had good quality parks and green spaces (13 per cent compared to 7 per cent of young people aged 16 to 24).
Theme 5: Compassionate city
The theme Compassionate city cross cuts the four other draft Belfast Agenda themes. The following section supplements evidence already presented above in relation to potential differential across the other Belfast Agenda themes.
Inclusive growth and anti-poverty
The Northern Ireland Poverty and Income Inequality Report for 2021/2022[Footnote 113] found that:
- Of all family types, couples without children had the lowest risk of being in relative poverty (10 per cent). The family type at the highest risk was single female pensioner (31per cent).
- The proportion of children in relative poverty is estimated to be 18 per cent (approximately 83,000 children) in 2021/2022. This is lower than the last available estimate of 22 per cent in 2019/2020. However, the long-term trend shows that children are at a higher risk of living in poverty than the overall population.
- 8 per cent of working-age adults in working households were in relative poverty compared to 53 per cent in workless households
- The estimated proportion of pensioners in relative poverty (after housing costs) was 16 per cent (approximately 47,000) in 2021/2022, an increase from the last available estimate of 13 per cent in 2019/2020. Over the last ten years pensioners have generally been at a lower risk of being in poverty (after housing costs) than the population as a whole.
According to Belfast City Council’s 2021 residents’ survey, people aged 65 and over were less likely to seek advice for debt or financial problems (6 per cent compared to 10 per cent aged 25 to 59 and 11 per cent aged 16 to 24). The use of foodbanks among those under 60 years of age has more than doubled since 2019 – from 2.5 per cent to 6.8 per cent for those aged 16 to 24 and from 2.8 per cent to 8.4 per cent for those aged 25 to 59. The use of foodbanks by those aged 60 and over has also increased from 5.6 per cent to 7.2 per cent.
Belfast City Council’s Inequalities Experienced by Black, Asian, Minority Ethnic and Traveller found that digital access is difficult for individuals in low-income situations. [Footnote 114]
According to Joseph Rowntree data for 2017 to 2020, 330,000 or almost 1 in 5 people in Northern Ireland live in poverty. This figure consists of 110,000 children, 190,000 working-age adults and 30,000 pensioners. Overall, pensioners have the lowest poverty rate (12 per cent), followed by working-age people (17 per cent). Poverty is highest among children with around one in four children (24 per cent) living in poverty. Other groups more impacted by poverty include disabled people “locked out of the labour market”, carers and single-parent families. [Footnote 115]
See also evidence in relation to the Good relations and shared future, Older people and Children and young people action plans.
Good relations and shared future
Religion/political background
According to Belfast City Council’s 2021 residents’ survey, 67 per cent of residents agree that their local area ‘is a place where people from different religions and political backgrounds get on well together’. This is a decrease from 79 per cent in 2017 (69 per cent in 2019). Young people aged 16 to 24 are least likely to agree.
Between July and June 2019, the PSNI recorded 1,292 hate crimes and incidents in NI comprising 281 sectarian incidents and 190 sectarian crimes, an increase of 14 and 32 respectively on the previous 12 months.
Ethnic background
According to the Racial Equality Indicators Report 2014–2021, the proportion of respondents reporting they were prejudiced against people from minority ethnic communities had increased from 24 per cent in 2014 to 30 per cent in 2021. However, the percentage of respondents with friends from a minority ethnic background increased from 42 per cent in 2014 to 57 per cent in 2021. [Footnote 116]
According to the NI Life and Times 2022 survey,[Footnote 117] 63 per cent of respondents from across NI had a favourable attitude to people from a different ethnic group than themselves.
| Attitudes towards people from a different ethnic group | Per cent |
|---|---|
| Very favourable | 25 |
| Favourable | 38 |
| Neither favourable nor unfavourable | 32 |
| Unfavourable | 2 |
| Very unfavourable | 1 |
| Don't know | 3 |
Across NI, people tend to be less accepting of people from the Muslim and Traveller communities. [Footnote 118]
According to Belfast City Council’s 2021 residents’ survey, 72 per cent of residents agree that their local area ‘is a place where people from different racial and ethnic backgrounds get on well together’. This is a decrease from 79 per cent in 2017 and an increase from 70 per cent in 2019. Young people aged 16 to 24 are least likely to agree.
According to Inequalities Experienced by Black, Asian, Minority Ethnic and Traveller people residing in Belfast, there are significant differences between ethnic and national groups depending on, for example, length of residence, levels of education, employment, class and background. For high-earning professionals, concerns about racial discrimination at work and safety are more prevalent as well as their ability to participate fully in Northern Ireland society. Long-established communities reflect on the lack of change over time for them in terms of work opportunities, exploitation and housing. First and subsequent generations continue to face issues with housing, work and racism. More recently arrived migrants highlight the difficulty of navigating basic services and accessing education and work opportunities to improve their prospects. [Footnote 119]
Poverty is a real risk for migrants who work in low-paid low-skilled jobs, who are parents of young children or who find the services supporting them already significantly stretched. Their children experience unfair disadvantage in schools and social activities because of language, perceived cultural or religious differences and racism. [Footnote 120]
Between July and June 2019, the PSNI recorded 1,292 hate crimes and incidents in NI comprising:
- 468 racist incidents, an increase of 2 on the previous 12 months
- 261 racist crimes, which was 13 fewer than the previous 12 months
Belfast City Council’s Inequalities Experienced by Black, Asian, Minority Ethnic and Traveller found that three-quarters of minority ethnic and migrant participants feel safe and secure in Belfast, compared to more than 90 per cent of the city’s residents overall. 38 per cent have experienced a racist hate crime in Belfast. Those who reported hate crimes to the police in the past are largely disinclined to do so again because of unsatisfactory outcomes. [Footnote 121]
Older people
On Census Day 2021, 14.7 per cent of Belfast’s population was aged 65 and over compared to the NI average of 17.2 per cent. NISRA projects that by 2041 in Belfast, 20.4 per cent of the population will be aged 65 or over, including 3.3 per cent ‘very elderly’ (that is aged 85 and over), an increase of 4,229 people or 58.2 per cent. [Footnote 122]
According to Belfast City Council’s 2021 residents’ survey, 76 per cent of residents agree that people aged 65 and over are treated with respect. However, almost 17 per cent of people aged 65 and over disagreed compared to 3 per cent of those aged 16 to 24.
Older people were least likely to agree that they could access all services they needed (83 per cent compared to 92 per cent for those aged 16 to 24).
People aged 65 and over were also more likely to disagree that they ‘were able to have a say on how services are run, what the priorities are or where investment is needed’ (24 per cent compared to 14 per cent of young people aged 16 to 24).
According to Queen’s University Belfast’s NI Cohort for the Longitudinal Study of Ageing (NICOLA), over a third of older people do not have enough money for household needs sometimes, often or most of the time. One in 10 reported that this kept them from keeping their house in a reasonable state of decoration or from replacing or repairing broken electrical items, and 8.5 per cent reported that this impacted on their choice of food. [Footnote 123]
The Housing Executive’s House Condition Survey (2016) indicated that in 2016, 22 per cent of all households were in fuel poverty, rising to 34 per cent of older household types and 38 per cent of households headed by a person aged 75 or over. [Footnote 124]
On Census Day 2021, there were 2,176 people in care homes or establishments in Belfast. [Footnote 125] In 2020 the number of people aged 65 and over in receipt of intensive domiciliary care[Footnote 126] in the Belfast Trust area was 1,182, an increase on the previous year’s figure of 1,014.
Children and young people
School census figures show growth of the resident minority ethnic population, from 1,366 minority ethnic and migrant pupils in 2002, to 17,400 in 2020. The schools census also identified that 4.3 per cent of the Belfast population aged 3 and over did not have English as their main language, which was higher than the NI average of 3.1 per cent. At October 2019 there were 3,720 newcomer pupils[Footnote 127] in Belfast, accounting for 21 per cent of all newcomer pupils across NI. [Footnote 128]
According to the Racial Equality Indicators Report 2014–2021, 54 per cent of young people reported witnessing racist bullying or harassment in their school, an increase from 39 per cent in 2014. [Footnote 129]
According to Belfast City Council’s 2021 residents’ survey, young people aged 16 to 24 are less likely to agree that ‘everyone fulfils their potential’ (49 per cent compared to 54 per cent for people aged 65 and over). Young people were also more likely to agree that they could access all services they needed (92 per cent compared to 83 per cent for people aged 65 and over) while 14 per cent disagree that they ‘were able to have a say on how services are run, what the priorities are or where investment is needed’.
According to the Youth Wellbeing Prevalence Survey 2020:
- 1 in 8 children and young people in NI experienced emotional difficulties
- 1 in 8 young people met criteria for a mood or anxiety disorder
- 1 in 7 has problems with hyperactivity
- boys aged 5 to 10 years had higher levels of emotional problems than girls in the same age group (19.3 per cent compared to 15.3 per cent)
- 19.7 per cent of young women aged 16 to 19 had emotional problems compared to 6.7 per cent of young men of the same age[Footnote 130]
According to research by the Rainbow Project, LGB young people are more likely than their heterosexual peers to experience bullying, exclusion and intimidation. This can lead to higher rates of depression, suicidal ideation, self-harm and other risk-taking behaviours. Young LGB people are 5 times more likely to be medicated for depression, 2.5 times more likely to self-harm and 3 times more likely to attempt suicide than their heterosexual counterparts. 28.6 per cent of young same-sex attracted men also showed signs of a mental health problem compared to 10.2 per cent of those who were attracted to the opposite sex. [Footnote 131]
Section 75 category dimensions
An analysis of the Belfast population by Section 75 dimension is included at Appendix 3.
7. Assessment of impacts
Through its five themes and related priorities, the revised Belfast Agenda 2023–2027 has at its core the aim of improving the wellbeing of all Belfast citizens, with the potential not only actively to promote equality of opportunity and good relations but also to tackle barriers and address issues of exclusion and marginalisation.
In accordance with the EQIA process, having gathered information on the revised Belfast Agenda 2023–2027 strategy and action plans, and those affected by it, the Council must then assess whether there is likely to be a differential impact on groups within one or more of the Section 75 categories before determining the extent of that differential impact and whether the impact is likely to be adverse.
At this time, in light of the work that has already been carried out over the last four years, and the overarching intent and goals of the refreshed Belfast Agenda, the analysis of available data reveals little concrete evidence to suggest that the proposals for action are likely to have a significant adverse impact on people of different religious belief, political opinion, ethnic origin, age, marital status, sexual orientation or sex/gender identity or on people with a disability or people without, or finally, people with dependants or people without.
This is primarily because the proposals attached to the key themes and associated priorities can broadly be cast as positive action measures designed generally to enhance and improve the quality of the lives of people in Belfast, irrespective of their identity.
At the same time, it would be naïve not to recognise the diverse ways in which issues attached to recognised inequalities may or may not be adversely affected or improved by the outworking of the revised agenda. Equally, the benefits accruing from this agenda are not likely to be spread evenly across the population of Belfast, and where it has the potential to widen, narrow or leave unaffected existing inequalities, should be acknowledged and addressed within the EQIA.
With this in mind, it is argued that the issues outlined are worthy of particular consideration during the forthcoming consultation, with an explicit understanding that the subsequent roll-out of the revised agenda must be carried out mindful of these considerations.
Comprehensive pre-consultation, on the refresh of the Belfast Agenda 2023–2027 strategy and action plans, occurred during 2022. During this pre-consultation phase all participants were asked to specifically consider equality issues and opportunities (‘How can we help everybody benefit from the Belfast Agenda?’) during workshop discussions.
In addition, at an equality, diversity and inclusion-themed workshop in Belfast City Hall, participants were asked to consider the opportunities, challenges or barriers that specific groups of people face, and any gaps or equality and diversity issues that we should consider moving forward.
To set the scene for these discussions, the long-term vision and ambitions of the Belfast Agenda were tested on stakeholders and found to be still relevant. At the same time, participants went on to acknowledge that minority communities should be highlighted as a new priority, specifically:
‘Participants discussed structural inequalities and the disproportionate impact of COVID, social exclusion, poverty and educational attainment on minority ethnic, migrant, and the LGBTQ+ communities. They expressed concern about how effectively the voices of these communities were being heard in the community planning process.’
Similarly, in relation to a proposed new priority of ‘Public engagement and inclusion’:
‘Participants discussed the importance of ordinary people having a say in the community plan, through better citizen engagement. They felt ensuring that “less-heard” from groups were given opportunities to get involved in decision making, and that participatory democracy in the city was deepened and strengthened.’
Tackling inequality and poverty’ was also proposed as a new priority as ‘Poverty was seen as an important issue that underpins everything else’.
At a workshop targeted at communities of interest, the report notes that minority communities:
‘Discussed the need to be sensitive to cultural differences when engaging with minority communities, and to build this consideration into engagement. They also highlighted the need for a targeted focus on vulnerable minority groups to ensure that the community plan relates to their needs.’
Overall, the pre-consultation highlighted considerable support from a range of Section 75 representative groups for the broad principles underpinning the agenda and continued engagement, from co-design through to co-delivery.
In relation to young people, it was argued that children and young people should be afforded a greater voice in the refreshed Belfast Agenda, starting from early years and continuing through to adolescence and beyond. Young people were identified as a priority group in relation to employability and skills, with the Covid-19 pandemic serving to highlight and exacerbate digital inequalities, in particular in relation to educational attainment. Overall, consultees felt that the children and young people action plan included in the revised agenda lacked clearly defined goals and detailed actions and that there should be greater reflection of the impact of poverty and the cost-of-living crisis on children and families. While this concern is duly noted, it is hoped that one of the central themes of the revised Agenda, a Compassionate City with explicit aspirations to promote inclusive growth and address the poverty divide, should go some way towards allaying these concerns.
One of the key ambitions of the agenda is to create 46,000 additional jobs within Belfast. While this ambition is laudable, the path from ambition to delivery should acknowledge that not all sections of the community may automatically benefit from this uplift.
For example, the so-called ‘digital divide’ has the potential to widen as increasing reliance is placed on different forms of electronic communication, with those with limited or no access to this technology facing the real prospect of further marginalisation. [Footnote 132]
This may include those without the necessary resources or skills to access, for example, social media. This could include older people, those with lower levels of educational attainment and/or literacy/numeracy, those in poverty, those with learning difficulties and those from minority or new communities. As one example, it is noteworthy that pre-consultation revealed that older people felt that they had been disproportionately affected by the Covid pandemic but ‘reported that they couldn't see themselves in the Belfast Agenda’. It is important that the agenda acknowledges this perception among older people and explores positive steps to overcome any resistance to future engagement.
While many sections of the population continue to embrace new technology with enthusiasm, there is a danger that marginalised groups and communities may become yet further distanced as a consequence of this trend (i.e. the ‘digital divide’). In addition, there is evidence that in the labour market, automation may have a differential impact on sectors traditionally characterised by greater numbers of women and those from minority communities. To avoid ‘widening the gap’ yet further, it will be important to consider mitigations that can be introduced into the revised agenda.
More generally, according to a recent adult skills survey, it has been estimated that around 17per cent of the adult population in Northern Ireland experience significant literacy problems and 24per cent have low levels of numeracy skills[Footnote 133], and often these deficits correlate with membership of Section 75 groups (e.g. age, ethnicity, disability). Such issues may inhibit engagement with a number of projects attached to the revised agenda unless deliberate actions are taken to remedy these concerns. With this in mind it is also noteworthy that lifelong learning was a gap that pre-consultees identified in relation to the educational inequalities’ priority attached to the refreshed agenda.
With regard to the local economy, Belfast is not alone in facing widespread and persistent inequalities and some consultees did suggest that there should be a greater focus on access and inequalities throughout the revised agenda, and particularly for disabled people, carers and those living in more deprived parts of the city. Childcare in particular was identified as a major barrier for women, single parents and low-income workers in relation to various crosscutting themes.
On different occasions, Protestant boys, women, returnees, Irish Travellers, members of new communities and those with a disability or caring responsibilities are routinely cited as being disadvantaged first in the world of education and training, and then in the world of work. Many of the economic initiatives likely to be linked to the revised agenda will rely on new technology and/or industries (i.e., mechanical/civil/electrical engineering, computer science, data management) that draw heavily on ‘STEM’ subjects in education (i.e., maths, IT, engineering and technology.
Historically a number of groups and communities have been seen as isolated or marginalised in relation to these mainstream economic and social activity (e.g., carers; lone parents; older people), or have experienced continuous cycles of deprivation that have been difficult to slow or curtail (e.g., Irish Travellers; members of new communities). Once more, it will be important to see how such groups can be effectively engaged in the range of economic projects likely to be attached to the revised agenda. It is unlikely that enhanced engagement will occur naturally but must instead be actively encouraged among these marginalised groups.
In relation to a number of the five themes, pre-consultation revealed that placemaking was considered particularly important for characterising the city as a welcoming and safe environment for young people and for those from the LGBTQIA+ communities. At the same time, other groups that would also be recognised as vulnerable should not be ignored and this would include women and girls generally, those with a disability and those from minority ethnic communities. In combination all these groups would welcome the development of safe public spaces within a compassionate and safe Belfast.
Several consultees stated that they would welcome further focus on good relations and peace building within the revised Belfast Agenda, while others argued that the existing grounds were too restrictive and that the list should be extended to a wider range of vulnerable people and groups. These are concerns that should be borne in mind as the agenda progresses.
In relation to the good relations and shared future priority, consultees queried the lack of reference to peace walls. Others felt that paramilitarism, sectarianism and racism should be explicitly named and challenged.
Consultees also felt there could be greater focus on interculturalism, intersectionality and on language and culture. Some participants felt that further reference to the Irish language in the revised agenda may go some way towards addressing perceptions that it is politic or divisive, instead recognising the positive contribution that indigenous and minority languages can make to the city, and, for example, supporting Irish-medium education, employment and cultural tourism.
Finally, with regard to those who are seen as most marginalised within Belfast, there was particular concern expressed for people with refugee status and people seeking asylum, with systemic biases that may impact on employment prospects, housing and quality of life generally.
In other ways, people with a disability, older people, people with limited mobility, parents with prams and buggies and newcomers (due to different language abilities and lack of knowledge about services and geographies) are likely to encounter additional barriers to the use of public transport and active travel generally, and their special needs should not be ignored in the roll-out of the revised agenda.
While on the one hand it can be argued that many of these deep-seated structural issues lie beyond the scope of the revised agenda, it can also be argued that all projects and initiatives attaching to the refreshed Belfast Agenda 2023-2027 should proceed mindful of the increasingly diverse needs of an increasingly diverse Belfast population, and without due regard to these concerns then the capacity for change will be limited.
8. Consideration of measures
The review of the updated draft Belfast Agenda strategy and action plans, as arranged under five themes and 13 priorities, is now being presented alongside the draft EQIA and Rural Needs Impact Assessment for public consultation.
This draft EQIA presents the findings of pre-consultation but awaits the outcome of the next phase of consultation before confirming updates to the draft Belfast Agenda 2023-2027.
Initially it is important to acknowledge that, in its present form, this draft agenda is likely to have an overall positive impact on the communities that it serves. While acknowledging this overarching positive effect, the pre-consultation phase has helped confirm key equality of opportunity and good relations issues that the Belfast Agenda 2023-2027 must recognise and address if all those who fall within its remit can be expected to reap the benefits of the agenda.
These issues have been made explicit by a number of consultees, not least the Equality Commission. The Commission underpins the need to highlight key inequalities and good relations within the agenda, and to see these not as peripheral concerns but as central to achieving economic growth, personal wellbeing and prosperity within the city.
Potential adverse impacts on ‘at risk’ groups have been identified in Section 7 above but the duty to translate sound theory into good practice must then reside not only with the architects of the agenda but all delivery agents, through appropriate engagement with key stakeholders. Co-design has already played a pivotal role in developing the draft agenda and should continue to characterise the implementation phases of the project. Other examples can include:
- an explicit commitment to meet Section 75 duties for the duration of the project by all partners and agents (including the private and community/voluntary sectors);
- a recognition of the need for diverse means of communication and engagement to access marginalised and hard to reach groups and communities;
- an acknowledgement of varying levels of educational attainment, including literacy, numeracy and digital skills among the population at large and including those service users involved in project design and delivery;
- a need to have concern for access and mobility considerations in all projects;
- a recognition that longstanding structural inequalities may serve to make particular initiatives or enterprises more or less accessible to particular Section 75 groups and communities;
- the need to adopt a flexible and responsive approach to managing good relations within the City.
This list is not exhaustive nor is it set in stone as the agenda evolves but instead it may be seen as indicative of how Section 75 principles can be mainstreamed into the outworkings of the revised agenda.
In addition to these considerations, the refreshed agenda must incorporate mechanisms for considering the real-world impact on equality of opportunity and good relations through a robust monitoring strategy. Specifically, monitoring systems should be put in place that will identify any differential impacts on Section 75 groups. This strategy must be mindful of identifying and addressing existing gaps in data/information, and should report on a regular basis.
Pre-consultation has highlighted the need to have available robust data by which to chart evidence of inertia or change, and information which should form the bedrock of the monitoring strategy running alongside the revised agenda. This monitoring strategy must have regard to Section 75 groups and include ‘robust outcome focused action measures’ that are attached to all projects and initiatives within the agenda.
At this draft stage of the agenda, a principled commitment to the above should help to ensure that the agenda ‘in theory’ at a strategic level has the capacity to help promote equality of opportunity and good relations and can deliver on its themes and priorities.
The translation of theory to practice however can be thwarted by many logistical constraints, including resources, and how individual actions are delivered must be subject to scrutiny during future implementation. Nevertheless, at this time a commitment can be made that each programme or project under the revised agenda will be subject to equality screening in line with the Council’s Equality Scheme and in accordance with the criteria set out in the guidance produced by ECNI.
A further final decision report, giving due regard to the comments made during consultation, will then be prepared for the consideration of the Council.
9. Consultation
Belfast City Council is committed to consultation which is timely, open and inclusive and conducted in accordance with the Equality Commission’s Guiding Principles. The consultation process in respect of this EQIA will last for a period of 12 weeks from 7 August to 30 October 2023
- All Equality Scheme consultees will be notified of the availability of this EQIA report and invited to comment. A general communication document will be prepared and issued through various sources to make the public aware of the EQIA and information about the EQIA will be placed on the Council’s website. Comments will be welcomed from any individual with an interest in the proposals. Submit all comments to:
EQIA - Belfast Agenda
Community Planning
Telephone: 0289032 0202
Email: [email protected]
Textphone: 028 9027 0405
SignVideo: www.belfastcity.gov.uk/contact
We arranged and facilitated:
- One public consultation event held at City Hall on 5 September at 6.30pm
- One public event, targeted towards equality organisations, held at City Hall on 6 September 2pm
- Twi online public consultation events on 20 September at 7pm and 21 September at 3pm
All consultation documents can be made available in hard copy, email and alternative formats on request and can be accessed on yoursay.belfastcity.gov.uk/draft-belfast-agenda
As much background information as possible has been included within this report. If there is any information which has not been provided, the Council will make every effort to do so on request. If any consultee has difficulty accessing the background information the Council will consider providing summaries in other formats or explaining issues on a face-to-face basis.
All comments and queries regarding this report should be addressed to:
EQIA - Belfast Agenda
Community Planning
Telephone: 028 9032 0202
Email: [email protected]
Textphone: 028 9027 0405
SignVideo: www.belfastcity.gov.uk/contact
10. Further steps
At the end of the consultation period, the EQIA report will be revised to take account of all comments received from consultees. The EQIA final decision report will then be submitted to council to assist them in reaching a decision in respect of the revised policy. The council’s decisions will be incorporated into a final summary report which will set out the consideration given to the impact of alternative policies and mitigating actions. This will complete Step 6 of the EQIA process.
The final summary report will be made available on the Council’s website. In addition, Equality Scheme consultees and those who responded to the consultation will be notified of the availability of the report.
Critical to the roll-out of the refreshed agenda will be the establishment of a robust system to monitor the impact of the agenda across all relevant Section 75 categories. While full details of the monitoring system will be included in the final decision report, it is likely to include a number of measures that will ensure effective monitoring of the agenda over time and thereby reinforce our commitment to continue to promote equality of opportunity for Section 75 groups.
For example, as part of the implementation of the refreshed BA and associated delivery plans, an updated performance management framework is being developed. The framework will aim to incorporate a bespoke Inclusive Growth Index which aims to track a series of city-wide and neighbourhood level statistics to show whether the root causes of inequality are being tackled collectively.
The aspiration is that this will collectively provide an insight into the extent to which Belfast can be regarded as an inclusive city and will be one tool to help quantitatively understand inclusive growth progress in a way which is accessible to all stakeholders and therefore can be jointly owned.
In addition, the Council is currently developing an Inclusive Growth Toolkit which it is hoped will help encourage inclusive growth through the design, development, monitoring and evaluation, and delivery of a strategy, project, programme or service.
Through these measures, and by generally adopting an active approach to inclusive growth, the Council aspires to enable everyone, but particularly the most disadvantaged, to fully participate in society.The results of ongoing monitoring will be reviewed on an annual basis and included in the annual review on progress to the Equality Commission. This review will be published on the Council’s website. This will complete Step 7 of the EQIA process.
Appendix 1: Organisations engaged in stage 1 pre-consultation
The following organisations gave permission to be named in the consultation report.
- Act Initiative
- Action Mental Health
- Alliance
- Ashton
- Belfast City Council
- Belfast Health and Social Care Trust
- Belfast Health Development Unit
- Belfast Health Cities
- Belfast Hills Partnership
- Belfast South Community Resource
- Blackstaff Residents' Association
- Bloomfield Community Association
- Cara-Friend
- Carlin Planning Limited
- Cedar Foundation
- Clan Mor Surestart
- Cliftonville Community Regeneration Forum/Crumlin-Ardoyne Neighbourhood Partnership
- Colin Neighbourhood Partnership
- Community Service
- Conor Rise Residents Association
- Conway Education Centre
- Cornerstone
- Counselling All Nations Services (CANS)
- Department for Communities Community Empowerment Division
- East Belfast Community Development Agency
- Eastside Arts
- Eastside Learning
- Eastside Partnership
- Extern Northern Ireland
- Fáilte Feirste Thiar
- FIT Ltd
- Forward South Belfast
- GEMS NI
- Housing Executive
- Impact Training (NI) Ltd
- Inspire
- Lagan Village Youth and Community Group
- Lenadoon Community Forum
- LORAG
- Mindwise
- New Lodge Duncairn Community Health Partnership
- NIACRO
- NICS
- Open Ormeau community collective
- Orchardville
- Parenting NI
- Queen's University Belfast
- RNIB
- Sailortown Regeneration
- Save the Children
- SDLP
- South Belfast Sure Start
- The Rainbow Project
- Upper Andersonstown Community Forum
- Upper Springfield Development Trust
- Top of the Rock HLC
- Volunteer Now
- Walkway Community Association
- West Belfast Partnership Board
- Windsor Women’s Centre
Appendix 2: Organisations engaged in stage 2 pre-consultation
The following organisations gave permission to be named in the consultation report
- Action Ability
- Africa House NI
- An Dream Dearg
- Ashton Community Trust
- Association of Talking Newspapers NI
- Ballymurphy Residents
- Belfast City Council
- Belfast Health and Social Care Trust
- Belfast Healthy Cities
- Belfast Philharmonic Society
- Black Mountain Shared Space
- Blackstaff Residents Association
- British Red Cross
- Bryson Care Migrant Help
- Business in the Community
- Cara-Friend
- Chinese Welfare Association
- Connected Community Care
- Counselling All Nations Services
- Department for Agriculture, Environment and
- Rural Affairs
- Department for Communities
- Divis Joint Development Committee (Frank
- Gillen Centre)
- Donegall Pass Community Forum
- East Belfast Community Development Agency
- East Belfast Mission
- Eastside Greenways
- Eastside Learning
- Eastside Partnership
- Extern NI
- Forbairt Feirste
- Glen Community Parent Youth Group
- Glór na Móna
- Greater Belfast Seniors Forum
- Greater Shankill Area Partnership
- Greater Village Regeneration Trust
- Here NI
- Holylands Our Voices
- Horn of Africa People's Aid NI
- Lenadoon Community Forum
- Linen Quarter BID
- LORAG (Lower Ormeau Residents
- Action Group)
- Lower Oldpark Community Association
- New Lodge Duncairn Community
- Health Partnership
- Newhill Youth and Community Centre
- NI Muslim Family Association
- NIACRO
- Northern Ireland Environment Link
- Northern Ireland Housing Executive
- Oasis Caring in Action Ltd
- PAPYRUS Prevention of Young Suicide
- Queen's University Belfast
- Raidió Fáilte
- Royal Society of Ulster Architects
- Sailortown Regeneration
- Save the Children
- The Executive Office
- Translink
- Upper Springfield Development Trust
- West Belfast Partnership Board
- White Ink Architects
Appendix 3: Belfast’s population by Section 75 dimension
Religious belief
On census day 2021, 43.5 per cent of the population of Belfast identified as Catholic and 29.7 per cent identified as Protestant. Belfast had a slightly higher percentage of people identifying as ‘Other’ or ‘None’ religion than the NI average. [Footnote 134]
| Location | Catholic (per cent) | Protestant and Other Christian (including Christian related) (per cent) | Other religions (per cent) | Religion or religion brought up in: None (per cent) | Not stated (per cent) |
|---|---|---|---|---|---|
| Belfast | 43.5 | 29.7 | 3.0 | 21.7 | 2.2 |
| NI | 42.3 | 37.4 | 1.3 | 17.4 | 1.6 |
Political opinion
Sixty councillors were elected to Belfast City Council at the last local council elections on 18 May 2023. The table provides an overview of the number of councillors by each political party.
| Party | No. of councillors |
|---|---|
| Sinn Féin | 22 |
| Democratic Unionist Party (DUP) | 14 |
| Alliance Party | 11 |
| Social Democratic and Labour Party (SDLP) | 5 |
| Green Party Northern Ireland | 3 |
| Ulster Unionist Party (UUP) | 2 |
| Independent | 1 |
| People Before Profit Alliance | 1 |
| Traditional Unionist Voice (TUV) | 1 |
| Total |
Ethnic background
According to the 2021 Census, the largest ethnic group in Belfast included people who identified as White (92.9 per cent), followed by Chinese (1.4 per cent), Indian (1.3 per cent), people of mixed ethnicity (1.2 per cent) and Black African (1.2 per cent). [Footnote 135] People born in other EU countries[Footnote 136] comprised 3.8 per cent of Belfast’s population, and people born in the rest of the world comprised 6.1 per cent. [Footnote 137]
| Ethnic background | Belfast | Northern Ireland |
|---|---|---|
| White | 92.9per cent | 96.6per cent |
| Irish Traveller | 0.1per cent | 0.1per cent |
| Roma | 0.1per cent | 0.1per cent |
| Indian | 1.3per cent | 0.5per cent |
| Chinese | 1.4per cent | 0.5per cent |
| Filipino | 0.5per cent | 0.2per cent |
| Pakistani | 0.1per cent | 0.1per cent |
| Arab | 0.3per cent | 0.1per cent |
| Other Asian | 0.5per cent | 0.3per cent |
| Black African | 1.2per cent | 0.4per cent |
| Black Other | 0.1per cent | 0.2per cent |
| Mixed | 1.2per cent | 0.8per cent |
| Other ethnicities | 0.3per cent | 0.2per cent |
Age
According to the 2021 Census, Belfast has a relatively young population with 55.2 per cent of the population aged under 40 compared to 50.4 per cent of the NI population. [Footnote 138]
| Location | 0-14 years | 15-39 years | 40-64 years | 65+ years |
|---|---|---|---|---|
| Belfast | 18.0per cent | 37.1per cent | 30.1per cent | 14.7per cent |
| Northern Ireland | 19.2per cent | 31.2per cent | 32.4per cent | 17.2per cent |
NISRA projects that the proportion of older people (aged 65+) will increase to 24.8 per cent by mid-2045. The proportion of older people will overtake the proportion of children (aged 0–15) for the first time by mid-2027. [Footnote 139]
Marital status
On Census day 2021, Belfast had a higher proportion of single residents than the whole NI population. [Footnote 140]
| Residents aged 16 and over | Belfast | Northern Ireland |
|---|---|---|
| Single (never married or registered civil partnership) | 49.8per cent | 38.1per cent |
| Married | 32.9per cent | 45.6per cent |
| In a civil partnership | 0.3per cent | 0.2per cent |
| Separated (but still legally married or in a civil partnership) | 4.7per cent | 3.8per cent |
| Divorced or formerly in a civil partnership which is now legally dissolved | 6.2per cent | 6.0per cent |
| Widowed or surviving partner from a civil partnership | 6.1per cent | 6.4per cent |
Sexual orientation
According to the 2021 Census, 87.1 per cent of the Belfast population identifies as straight or heterosexual, which is less than across the who NI population (90.0 per cent). [Footnote 141]
| Straight or heterosexual | Gay or lesbian | Bisexual | Other sexual orientation | Prefer not to say | Not stated | |
|---|---|---|---|---|---|---|
| Belfast | 87.1per cent | 2.3per cent | 1.5per cent | 0.3per cent | 5.2per cent | 3.6per cent |
| Northern Ireland | 90.0per cent | 1.2per cent | 0.7per cent | 0.2per cent | 4.6per cent | 3.3per cent |
Men and women generally
At 51.3 per cent, Belfast has slightly more female residents than male. The difference is largest in the over 65 population. [Footnote 142]
Disability
The 2021 Census asked people to what extent a long-term health problem or disability limits their day-to-day activities. Just over 1 in 4 (26.7 per cent) Belfast residents have a limiting health condition or disability, which is higher than the proportion of residents across NI. [Footnote 143]
| Location | Day-to-day activities limited a lot | Day-to-day activities limited a little | Day-to-day activities not limited |
|---|---|---|---|
| Belfast | 13.6per cent | 13.2per cent | 73.3per cent |
| Northern Ireland | 11.5per cent | 12.9per cent | 75.7per cent |
Belfast residents are also more likely to have multiple long-term health conditions (18.9 per cent compared to the NI average of 16.6). [Footnote 144]
Dependants
The 2021 Census found that 28.6 per cent of households in Belfast included a dependent child compared to 33.9 per cent of households across NI. This includes 19.2 per cent which are lone parent households (higher than the NI average of 17.1 per cent). [Footnote 145]
The 2021 Census also found that 12.3 per cent of Belfast residents provide unpaid care for a dependant adult. People aged 40 to 64 (20.1 per cent) and 65 and over (12.0 per cent) are most likely to provide unpaid care. [Footnote 146]
Footnotes
[Footnote 1] www.jamcard.org
[Footnote 2] Belfast City Council, five other local councils, two universities and four further education colleges
[Footnote 3] n=134
[Footnote 4] n=414
[Footnote 5] www.health-ni.gov.uk/publications/general-health-tables-health-survey-northern-ireland-marital-status-and-religion-breakdowns
[Footnote 6] www.ninis2.nisra.gov.uk
[Footnote 7] www.ninis2.nisra.gov.uk
[Footnote 8] www.belfastcity.gov.uk/inequalities
[Footnote 9] www.health-ni.gov.uk/publications/life-expectancy-northern-ireland-2019-21
[Footnote 10] www.ninis2.nisra.gov.uk
[Footnote 11] www.health-ni.gov.uk/publications/general-health-tables-health-survey-northern-ireland-marital-status-and-religion-breakdowns
[Footnote 12] https://www.health-ni.gov.uk/publications/health-survey-northern-ireland-first-results-202122
[Footnote 13] www.communities-ni.gov.uk/publications/engagement-culture-arts-heritage-and-sport-by-adults-northern-ireland-202122
[Footnote 14] www.nisra.gov.uk/publications/census-2021-main-statistics-health-disability-and-unpaid-care-tables
[Footnote 15] www.nisra.gov.uk/publications/census-2021-main-statistics-health-disability-and-unpaid-care-tables
[Footnote 16] www.nisra.gov.uk/publications/census-2021-main-statistics-health-disability-and-unpaid-care-tables
[Footnote 17] www.nisra.gov.uk/publications/census-2021-main-statistics-health-disability-and-unpaid-care-tables
[Footnote 18] www.communities-ni.gov.uk/publications/engagement-culture-arts-heritage-and-sport-by-adults-northern-ireland-202122
[Footnote 19] www.rainbow-project.org/wp-content/uploads/2021/03/through_our_minds.pdf
[Footnote 20] www.nisra.gov.uk/publications/census-2021-main-statistics-health-disability-and-unpaid-care-tables
[Footnote 21] www.communities-ni.gov.uk/publications/engagement-culture-arts-heritage-and-sport-by-adults-northern-ireland-202122
[Footnote 22] www.health-ni.gov.uk/publications/general-health-tables-health-survey-northern-ireland-marital-status-and-religion-breakdowns
[Footnote 23] www.communities-ni.gov.uk/publications/engagement-culture-arts-heritage-and-sport-by-adults-northern-ireland-202122
[Footnote 24] https://www.psni.police.uk/sites/default/files/2022-12/Hateper cent20Motivatedper cent20Incidentsper cent20andper cent20Crimesper cent20inper cent20Northernper cent20Irelandper cent202004-05per cent20toper cent202021-22.pdf
[Footnote 25] www.ninis2.nisra.gov.uk
[Footnote 26] www.psni.police.uk/sites/default/files/2022-12/Hateper cent20Motivatedper cent20Incidentsper cent20andper cent20Crimesper cent20inper cent20Northernper cent20Irelandper cent202004-05per cent20toper cent202021-22.pdf
[Footnote 27] https://www.belfastcity.gov.uk/inequalities#:~:text=fromper cent20thisper cent20research.-,Diversityper cent20inper cent20Belfast,andper cent20Blackper cent20Africanper cent20(1.19per cent25).
[Footnote 28] https://www.belfastcity.gov.uk/inequalities#:~:text=fromper cent20thisper cent20research.-,Diversityper cent20inper cent20Belfast,andper cent20Blackper cent20Africanper cent20(1.19per cent25).
[Footnote 29] www.psni.police.uk/sites/default/files/2022-12/Hateper cent20Motivatedper cent20Incidentsper cent20andper cent20Crimesper cent20inper cent20Northernper cent20Irelandper cent202004-05per cent20toper cent202021-22.pdf
[Footnote 30] www.psni.police.uk/system/files/2023-05/443047986/Hateper cent20Motivationsper cent20Bulletinper cent20Periodper cent20endingper cent2031stper cent20Marchper cent202023.pdf
[Footnote 31] www.ninis2.nisra.gov.uk
[Footnote 32] www.psni.police.uk/sites/default/files/2022-12/Hateper cent20Motivatedper cent20Incidentsper cent20andper cent20Crimesper cent20inper cent20Northernper cent20Irelandper cent202004-05per cent20toper cent202021-22.pdf
[Footnote 33] Through Our Eyes: Perceptions and Experiences of Lesbian, Gay and Bisexual People towards Homophobic Hate Crime and Policing in Northern Ireland, www.rainbow-project.org/wp-content/uploads/2021/03/through_our_eyes.pdf
[Footnote 34] www.equalityni.org/ECNI/media/ECNI/Publications/Deliveringper cent20Equality/EducationKeyInequalities-KeyPointBriefing.pdf
[Footnote 35] www.education-ni.gov.uk/publications/school-leavers-202021
[Footnote 36] www.education-ni.gov.uk/publications/school-enrolments-northern-ireland-summary-data
[Footnote 37] www.equalityni.org/ECNI/media/ECNI/Publications/Deliveringper cent20Equality/EducationKeyInequalities-KeyPointBriefing.pdf
[Footnote 38] www.economy-ni.gov.uk/sites/default/files/publications/economy/Skills-Barometer-2021-Summary-Report.pdf
[Footnote 39] www.equalityni.org/ECNI/media/ECNI/Publications/Deliveringper cent20Equality/EducationKeyInequalities-KeyPointBriefing.pdf
[Footnote 40] http://www.niassembly.gov.uk/globalassets/documents/raise/publications/2017-2022/2022/education/1622.pdf
[Footnote 41] www.education-ni.gov.uk/publications/school-leavers-202021
[Footnote 42] www.education-ni.gov.uk/publications/school-enrolments-northern-ireland-summary-data
[Footnote 43] www.equalityni.org/ECNI/media/ECNI/Publications/Deliveringper cent20Equality/EducationKeyInequalities-KeyPointBriefing.pdf
[Footnote 44] www.belfastcity.gov.uk/inequalities
[Footnote 45] www.nisra.gov.uk/publications/highest-qualification-level-2021
[Footnote 46] https://www.nisra.gov.uk/publications/highest-qualification-level-2021
[Footnote 47] www.economy-ni.gov.uk/sites/default/files/publications/economy/Skills-Barometer-2021-Summary-Report.pdf
[Footnote 48] https://www.assemblyresearchmatters.org/2021/11/16/an-overview-of-the-digital-divide-in-northern-ireland/
[Footnote 49] https://www.equalityni.org/ECNI/media/ECNI/Consultationper cent20Responses/2021/DfE-DraftSkillsStrategyNI.pdf?ext=.pdf
[Footnote 50] www.equalityni.org/ECNI/media/ECNI/Publications/Deliveringper cent20Equality/EducationKeyInequalities-KeyPointBriefing.pdf
[Footnote 51] www.nisra.gov.uk/publications/census-2021-main-statistics-labour-market-tables
[Footnote 52] https://online.hscni.net/our-work/social-care-and-children/youth-wellbeing-prevalence-survey-2020/
[Footnote 53] www.education-ni.gov.uk/publications/school-leavers-202021
[Footnote 54] www.nisra.gov.uk/publications/quarterly-labour-force-survey-tables-february-2023
[Footnote 55] www.economy-ni.gov.uk/sites/default/files/publications/economy/Skills-Barometer-2021-Summary-Report.pdf
[Footnote 56] https://www.equalityni.org/ECNI/media/ECNI/Consultationper cent20Responses/2021/DfE-DraftSkillsStrategyNI.pdf?ext=.pdf
[Footnote 57] www.equalityni.org/ECNI/media/ECNI/Publications/Deliveringper cent20Equality/EducationKeyInequalities-KeyPointBriefing.pdf
[Footnote 58] www.equalityni.org/ECNI/media/ECNI/Publications/Deliveringper cent20Equality/FETOper cent20Monitoringper cent20Reports/No32/MonReport32.pdf
[Footnote 59] www.executiveoffice-ni.gov.uk/labour-force-survey-religion-reports
[Footnote 60] www.ninis2.nisra.gov.uk
[Footnote 61] www.equalityni.org/KeyInequalities-Employment
[Footnote 62] www.belfastcity.gov.uk/inequalities
[Footnote 63] www.belfastcity.gov.uk/inequalities
[Footnote 64] www.equalityni.org/ECNI/media/ECNI/Publications/Deliveringper cent20Equality/FETOper cent20Monitoringper cent20Reports/No32/MonReport32.pdf
[Footnote 65] www.nisra.gov.uk/taxonomy/term/151/#toc-4
[Footnote 66] https://datavis.nisra.gov.uk/economy-and-labour-market/employee-earnings-NI-2022.html
[Footnote 67] www.equalityni.org/KeyInequalities-Employment
[Footnote 68] www.equalityni.org/ECNI/media/ECNI/Publications/Deliveringper cent20Equality/EducationKeyInequalities-KeyPointBriefing.pdf
[Footnote 69] www.equalityni.org/KeyInequalities-Employment
[Footnote 70] www.equalityni.org/KeyInequalities-Employment
[Footnote 71] www.nisra.gov.uk/taxonomy/term/151/#toc-4
[Footnote 72] https://datavis.nisra.gov.uk/economy-and-labour-market/employee-earnings-NI-2022.html
[Footnote 73] https://datavis.nisra.gov.uk/economy-and-labour-market/employee-earnings-NI-2022.html
[Footnote 74] www.economy-ni.gov.uk/sites/default/files/publications/economy/Skills-Barometer-2021-Summary-Report.pdf
[Footnote 75] https://www.assemblyresearchmatters.org/2021/11/16/an-overview-of-the-digital-divide-in-northern-ireland/
[Footnote 76] www.nisra.gov.uk/publications/census-2021-main-statistics-labour-market-tables
[Footnote 77] www.communities-ni.gov.uk/sites/default/files/publications/communities/dfc-disability-within-northern-ireland-labour-market-2022.pdf
[Footnote 78] www.equalityni.org/KeyInequalities-Employment
[Footnote 79] www.economy-ni.gov.uk/sites/default/files/publications/economy/Skills-Barometer-2021-Summary-Report.pdf
[Footnote 80] https://www.equalityni.org/ECNI/media/ECNI/Consultationper cent20Responses/2021/DfE-DraftSkillsStrategyNI.pdf?ext=.pdf
[Footnote 81] www.rainbow-project.org/wp-content/uploads/2021/03/TOE_mcd.pdf
[Footnote 82] www.equalityni.org/KeyInequalities-Employment
[Footnote 83] www.nisra.gov.uk/publications/census-2021-main-statistics-labour-market-tables
[Footnote 84] www.equalityni.org/KeyInequalities-Employment
[Footnote 85] McQuaid, R., Shapira, M., Graham, H. and Raeside, R. (2013) Economic Inactivity Research Project (those with family commitments and the long-term sick and disabled) - Literature Review (Project-11040), Department for Employment and Learning, Northern Ireland
[Footnote 86] www.nisra.gov.uk/publications/quarterly-labour-force-survey-tables-february-2023
[Footnote 87] www.nisra.gov.uk/publications/quarterly-labour-force-survey-tables-february-2023
[Footnote 88] www.communities-ni.gov.uk/publications/northern-ireland-housing-statistics-2021-22
[Footnote 89] www.equalityni.org/ECNI/media/ECNI/Publications/Deliveringper cent20Equality/HousingCommunities-KeyInequalitiesStatement.pdf
[Footnote 90] https://www.belfastcity.gov.uk/inequalities#:~:text=fromper cent20thisper cent20research.-,Diversityper cent20inper cent20Belfast,andper cent20Blackper cent20Africanper cent20(1.19per cent25)
[Footnote 91] www.communities-ni.gov.uk/publications/northern-ireland-housing-statistics-2021-22
[Footnote 92] www.equalityni.org/ECNI/media/ECNI/Publications/Deliveringper cent20Equality/HousingCommunities-KeyInequalitiesStatement.pdf
[Footnote 93] www.equalityni.org/ECNI/media/ECNI/Publications/Deliveringper cent20Equality/HousingCommunities-KeyInequalitiesStatement.pdf
[Footnote 94] www.communities-ni.gov.uk/publications/northern-ireland-housing-statistics-2021-22
[Footnote 95] www.communities-ni.gov.uk/publications/northern-ireland-housing-statistics-2021-22
[Footnote 96] www.equalityni.org/ECNI/media/ECNI/Publications/Deliveringper cent20Equality/HousingCommunities-KeyInequalitiesStatement.pdf
[Footnote 97] www.communities-ni.gov.uk/publications/northern-ireland-housing-statistics-2021-22
[Footnote 98] www.equalityni.org/ECNI/media/ECNI/Publications/Deliveringper cent20Equality/HousingCommunities-KeyInequalitiesStatement.pdf
[Footnote 99] www.communities-ni.gov.uk/publications/northern-ireland-housing-statistics-2021-22
[Footnote 100] www.equalityni.org/ECNI/media/ECNI/Publications/Deliveringper cent20Equality/HousingCommunities-KeyInequalitiesStatement.pdf
[Footnote 101] www.equalityni.org/ECNI/media/ECNI/Publications/Deliveringper cent20Equality/HousingCommunities-KeyInequalitiesStatement.pdf
[Footnote 102] www.communities-ni.gov.uk/publications/northern-ireland-housing-statistics-2021-22
[Footnote 103] www.communities-ni.gov.uk/publications/northern-ireland-housing-statistics-2021-22
[Footnote 104] https://www.belfastcity.gov.uk/inequalities#:~:text=fromper cent20thisper cent20research.-,Diversityper cent20inper cent20Belfast,andper cent20Blackper cent20Africanper cent20(1.19per cent25).
[Footnote 105] www.infrastructure-ni.gov.uk/publications/walking-cycling-and-public-transport-northern-ireland-202122
[Footnote 106] www.infrastructure-ni.gov.uk/publications/attitudes-towards-electric-vehicles-northern-ireland-20212022
[Footnote 107] https://www.infrastructure-ni.gov.uk/publications/attitudes-towards-electric-vehicles-northern-ireland-20212022
[Footnote 108] www.infrastructure-ni.gov.uk/publications/walking-cycling-and-public-transport-northern-ireland-202122
[Footnote 109] www.infrastructure-ni.gov.uk/publications/attitudes-towards-electric-vehicles-northern-ireland-20212022
[Footnote 110] www.infrastructure-ni.gov.uk/publications/walking-cycling-and-public-transport-northern-ireland-202122
[Footnote 111] www.infrastructure-ni.gov.uk/publications/attitudes-towards-electric-vehicles-northern-ireland-20212022
[Footnote 112] https://www.infrastructure-ni.gov.uk/publications/attitudes-towards-electric-vehicles-northern-ireland-20212022
[Footnote 113] www.communities-ni.gov.uk/system/files/publications/communities/ni-poverty-income-inequality-report-202122.pdf
[Footnote 114] https://www.belfastcity.gov.uk/inequalities#:~:text=fromper cent20thisper cent20research.-,Diversityper cent20inper cent20Belfast,andper cent20Blackper cent20Africanper cent20(1.19per cent25).
[Footnote 115] www.jrf.org.uk/report/poverty-northern-ireland-2022
[Footnote 116] www.executiveoffice-ni.gov.uk/publications/racial-equality-indicators-report-2014-2021
[Footnote 117] www.ark.ac.uk/nilt/results/comrel.html
[Footnote 118] www.ark.ac.uk/ARK/sites/default/files/2018-11/update122.pdf
[Footnote 119] www.belfastcity.gov.uk/inequalities
[Footnote 120] www.belfastcity.gov.uk/inequalities
[Footnote 121] www.belfastcity.gov.uk/inequalities
[Footnote 122] www.nisra.gov.uk/statistics/population/national-population-projections
[Footnote 123] www.makinglifebettertogether.com/wp-content/uploads/2022/06/Age-Friendly-Belfast-Baseline-2022.pdf
[Footnote 124] The 2021 survey has been delayed until 2022 as a result of the pandemic.
[Footnote 125] www.nisra.gov.uk/publications/census-2021-main-statistics-communal-establishment-tables
[Footnote 126] The intensive domiciliary support scheme provides as with all aspects of daily living such as personal care tasks, medication, meal provision, household tasks, shopping and carer relief.
[Footnote 127] A newcomer pupil is one who has enrolled in a school but who does not have the satisfactory language skills to participate fully in the school curriculum, and the wider environment, and does not have a language in common with the teacher, whether that is English or Irish.
[Footnote 128] www.education-ni.gov.uk/articles/school-enrolments-overview
[Footnote 129] www.executiveoffice-ni.gov.uk/publications/racial-equality-indicators-report-2014-2021
[Footnote 130] https://online.hscni.net/our-work/social-care-and-children/youth-wellbeing-prevalence-survey-2020/
[Footnote 131] www.rainbow-project.org/wp-content/uploads/2021/03/out_on_your_own.pdf
[Footnote 132] https://www.assemblyresearchmatters.org/2021/11/16/an-overview-of-the-digital-divide-in-northern-ireland/
[Footnote 133] https://gpseducation.oecd.org/CountryProfile?primaryCountry=NIR&treshold=5&topic=AS
[Footnote 134] www.nisra.gov.uk/publications/census-2021-main-statistics-religion-tables
[Footnote 135] www.nisra.gov.uk/publications/census-2021-main-statistics-ethnicity-tables
[Footnote 136] Excluding NI, GB and ROI
[Footnote 137] www.nisra.gov.uk/publications/census-2021-main-statistics-demography-tables-country-of-birth
[Footnote 138] www.nisra.gov.uk/publications/census-2021-main-statistics-demography-tables-age-and-sex
[Footnote 139] www.nisra.gov.uk/publications/2020-based-interim-population-projections-northern-ireland
[Footnote 140] www.nisra.gov.uk/publications/census-2021-main-statistics-demography-tables-household-relationships
[Footnote 141] www.nisra.gov.uk/publications/census-2021-main-statistics-sexual-orientation-tables
[Footnote 142] www.nisra.gov.uk/publications/census-2021-main-statistics-demography-tables-age-and-sex
[Footnote 143] www.nisra.gov.uk/publications/census-2021-main-statistics-health-disability-and-unpaid-care-tables
[Footnote 144] www.nisra.gov.uk/publications/census-2021-main-statistics-health-disability-and-unpaid-care-tables
[Footnote 145] www.nisra.gov.uk/publications/census-2021-main-statistics-demography-tables-household-relationships
[Footnote 146] www.nisra.gov.uk/publications/census-2021-main-statistics-health-disability-and-unpaid-care-tables